 BTC
BTC  ETH
ETH  USDT
USDT  BNB
BNB  XRP
XRP  USDC
USDC  SOL
SOL  TRX
TRX  ZEC
ZEC  FIGR_HELOC
  HYPE
HYPE  DOGE
DOGE  XMR
XMR  WBT
WBT 
Litecoin (LTC) Price Prediction: Litecoin Consolidates Near $49 After Breakout—Can LTC Reach $58 Next?
Litecoin (LTC) is consolidating near $49 after a sharp August breakout pushed the cryptocurrency above a multi-month trading range. The move has shifted the near-term Litecoin price analysis toward whether former resistance can become support and provide a foundation for another advance toward $58.


The Litecoin price closed at $49.31 on August 28, according to historical market data, after trading between $48.24 and $50.41 during the session. The pullback follows a much stronger move earlier in the month: Litecoin climbed from a $44.34 close on August 19 to $53.12 on August 21, while the August 22 session reached a high of $55.21.
That sequence makes the $46-$48 area particularly important. It was previously viewed as the upper boundary of a roughly three-month accumulation range and is now being tested as potential support.
Litecoin Price Holds Above the Breakout Zone
The latest Litecoin price today picture is more balanced than the initial breakout suggested.
LTC spent much of August below $48 before breaking higher. The move accelerated on August 21, when the coin opened near $47.84 and reached $54.08, eventually closing at $53.12. Trading volume also increased substantially, with CoinLore recording roughly $605 million in daily volume on that session compared with about $333 million on August 20.
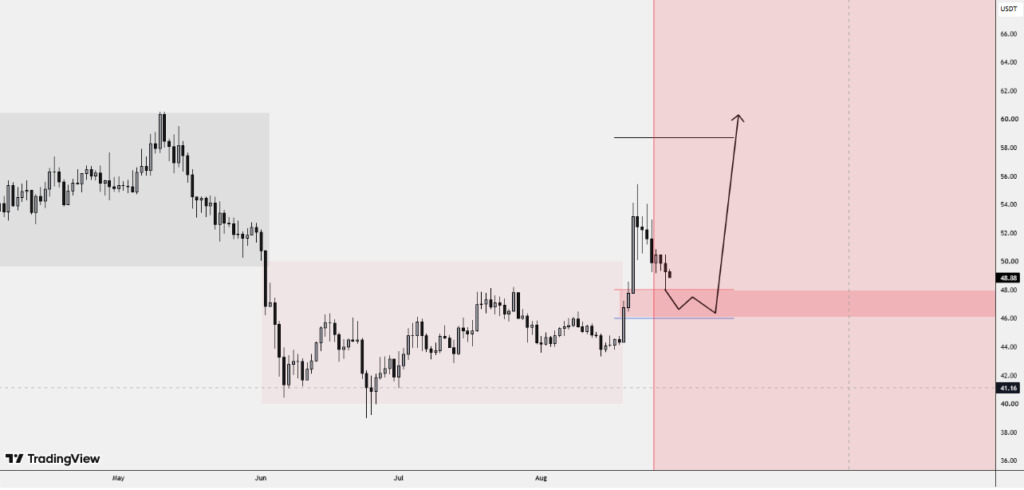
However, the breakout has not developed into a straight-line rally. Litecoin subsequently reached $55.21 on August 22 before retreating toward the $49 area.
This type of price action matters because a breakout is generally more convincing when the former resistance zone holds during a subsequent pullback. If LTC continues to trade above the $46-$48 region and begins forming higher lows, the structure would remain constructive.
A sustained move back below that area would present a different picture and could indicate that the breakout lacked sufficient follow-through.
LTC Price Prediction: Can Litecoin Reach $58?
For the current LTC price prediction, $58 is a technically significant upside reference rather than a guaranteed target.
The level sits above the recent August high and near a previous resistance area identified in earlier Litecoin price analysis. Litecoin first needs to regain momentum above the $50-$52 region before the $55 high and then $58 become realistic technical checkpoints.
A possible bullish sequence would therefore look like:
- $46-$48: Major breakout-retest support zone
- $49-$50: Immediate consolidation area
- $52-$55: First major resistance band
- $58: Next upside objective if the August high is decisively cleared
- $60+: Higher resistance and potential range-projection area
The key distinction is confirmation. A brief move above $55 would not necessarily establish a sustained trend. A stronger signal would be a daily close above the recent high accompanied by expanding trading activity.
One market analysis also identified $58 as a significant resistance level for Litecoin, although the broader technical structure remained cautious earlier in August.
Technical Indicators Present a Mixed Picture
The broader technical setup does not provide a uniformly bullish signal.
TradingView’s technical summary has described Litecoin’s primary timeframe as neutral, while its oscillator group has also remained broadly neutral. Moving averages have offered a comparatively stronger reading, with shorter and intermediate averages providing some support while longer-term averages continue to create overhead resistance.
Another recent technical assessment placed LTC near its 200-day simple moving average. On August 27, CoinMarketCap’s technical analysis reported LTC around $50.27, above its 30-day SMA of $46.41 but close to its 200-day SMA of $50.61. Its reported MACD histogram was positive at 0.55422, suggesting that short-term momentum had improved even though the broader picture remained mixed.
The RSI picture is similarly important. Recent readings have generally remained around the middle of the range rather than showing an extreme overbought condition. That leaves room for additional movement in either direction, but it also means momentum has not yet reached the level normally associated with a decisive trend acceleration.
The implication is straightforward: LTC does not currently have enough technical evidence to treat $58 as a confirmed destination. Instead, the market needs to demonstrate that buyers can defend support and overcome resistance in stages.
$48 Support Becomes the Key Test
The $46-$48 zone is arguably the most important area in the current LTC price prediction.
The significance comes from market structure. Litecoin spent months trading within a broader $40-$48 range before breaking higher. After such a move, traders commonly watch the previous ceiling for evidence that resistance has turned into support.
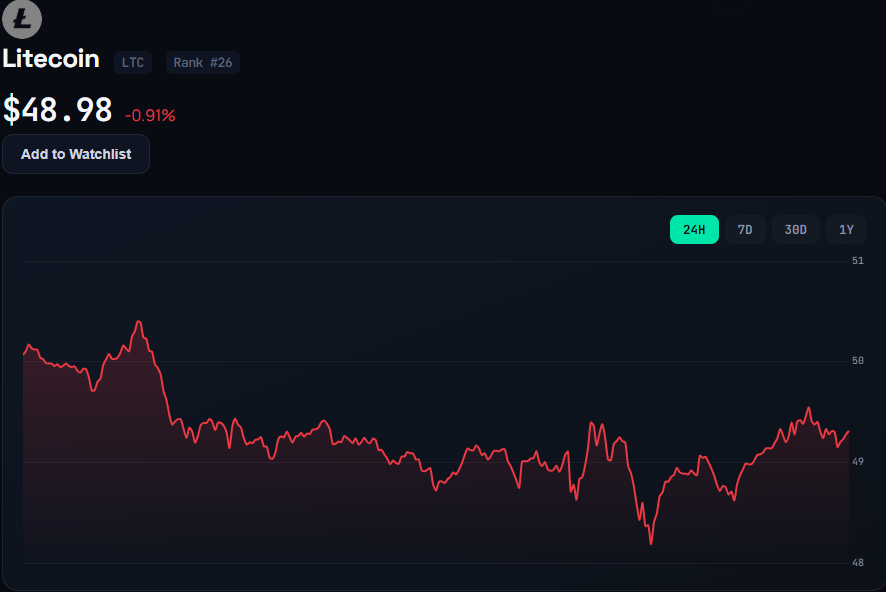
Recent price data provides some evidence for this transition. LTC moved above $48 on August 20 and accelerated the following day sharply. Although the price later retreated, it has remained considerably above the $40 area that defined much of the earlier consolidation.
A clean breakdown through $48 would weaken the breakout thesis. A deeper move below $46 would provide an even stronger warning because it would place LTC back near the former range boundary.
Conversely, repeated tests of $48 that are followed by higher lows would strengthen the argument that buyers are absorbing selling pressure.
Resistance Between $50 and $55
The immediate challenge for Litecoin is not $58. It is the resistance cluster between approximately $50 and $55.
LTC has already struggled to maintain levels above $50 several times during the second half of August. Historical data shows a progression from $52.53 on August 22 to $49.90 on August 25 and then $49.31 on August 28.
This indicates that sellers have remained active above $50.
The $52 area is particularly relevant because Litecoin was rejected around that region during its recent retracement. CoinMarketCap’s August 27 analysis identified $52 as resistance and $49.36 as an important Fibonacci support, with a break below that level potentially exposing approximately $47.35.
Therefore, a sustained recovery above $52 would improve the short-term structure. A move through $55 would be more significant because it would clear the recent swing high.
What Could Send LTC Toward $58?
Several conditions would need to align for the Litecoin forecast to turn more convincingly bullish.
First, LTC would need to preserve the $46-$48 breakout region. Second, buyers would need to reclaim $52 and eventually challenge the $55 August high. Third, trading volume would ideally expand during those advances rather than price rising on declining participation.
The broader cryptocurrency market is another important variable. Litecoin has recently shown sensitivity to movements in Bitcoin and the wider digital-asset market. CoinMarketCap’s recent analysis attributed part of Litecoin’s August weakness to broader market conditions rather than a Litecoin-specific negative catalyst.
That correlation means an isolated LTC breakout may have difficulty sustaining momentum if major cryptocurrencies weaken simultaneously.
There is also a structural catalyst worth monitoring: the Litecoin ETF market. Canary Capital’s LTCC product currently provides exposure to Litecoin, with the fund reporting Litecoin holdings and a 0.95% sponsor fee as of late August. The existence of an exchange-traded product does not guarantee higher LTC prices, but it gives investors another regulated-market vehicle for gaining exposure to the asset.
Bearish Scenario if $48 Fails
The bullish setup would become less convincing if Litecoin loses the $46-$48 zone and fails to recover it.
The first downside reference would be around $47, followed by the lower portions of the previous accumulation range. The broader historical structure shows that Litecoin traded near $40 earlier in August before beginning its recovery.
A sustained return below the breakout area would therefore raise the possibility that the August move was a failed breakout rather than the beginning of a new uptrend.
The risk is particularly relevant because the weekly and monthly technical ratings cited in the source material remain weaker than the daily moving-average picture. In other words, short-term improvement has not yet erased the longer-term selling pressure.
Litecoin Price Prediction: What to Watch Next
The current Litecoin predictions should be viewed through price confirmation rather than a single headline target.
The bullish case remains technically viable while LTC holds the $46-$48 breakout region. A recovery through $52 would strengthen that view, while a break above $55 would place $58 firmly in focus.
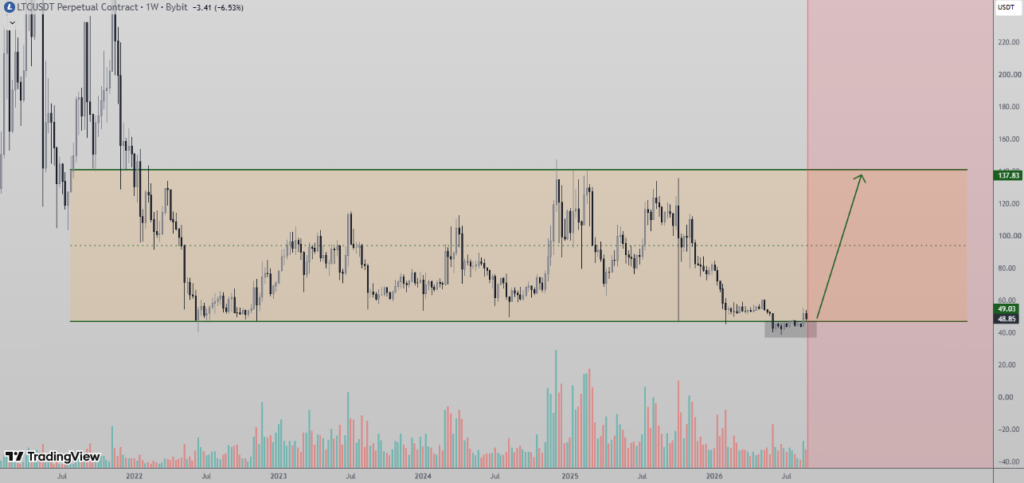
The bearish case becomes more credible if LTC loses $48 and especially if it closes decisively below $46.
For now, the market sits between those two outcomes. Litecoin has demonstrated that buyers can generate strong upside momentum, but the subsequent retreat from $55 shows that sellers remain active at higher levels.

Riva A. Nahar joins our team as a Crypto Journalist, covering cryptocurrency markets, blockchain developments, DeFi, and emerging trends across the digital-asset industry. With a focus on clear, accurate, and well-researched reporting, Riva brings a balanced perspective to fast-moving crypto news and market developments. Her work aims to make complex industry developments accessible while maintaining strong journalistic standards.
View all stories by Riva A. Nahar →