 BTC
BTC  ETH
ETH  USDT
USDT  BNB
BNB  XRP
XRP  USDC
USDC  SOL
SOL  TRX
TRX  ZEC
ZEC  FIGR_HELOC
  HYPE
HYPE  DOGE
DOGE  XMR
XMR  WBT
WBT 
Litecoin (LTC) Price Prediction: LTC Risks Deeper Losses After Losing Its 4H Trendline
Litecoin (LTC) is facing renewed downside pressure after breaking below an ascending trendline that had guided its recovery from the June low.


The latest Litecoin price move has weakened the short-term bullish structure, placing the $44.30–$42.80 area in focus as the next potential support zone.
LTC was trading around $45.21 in the latest July 29 market snapshot, down approximately 2.02% on the session. The decline comes as Litecoin remains below several short- and medium-term moving averages, while its broader technical profile continues to lean bearish.
Still, the selloff has not yet confirmed a deeper breakdown. Litecoin recently found buyers near the $40 area, and one technical study suggests the cryptocurrency may be attempting to form a broader bottom. For the current LTC price prediction, the key question is whether buyers can defend the low-$40s or whether another leg lower develops.
Litecoin Price Breaks 4H Trendline
Technical analyst @AlienOvichO noted that Litecoin has broken below the ascending trendline connecting its June low on the four-hour chart. The breakdown reverses the more constructive setup seen earlier and indicates that the recovery structure has lost some of its momentum.

The immediate area to watch is between $44.30 and $42.80. The zone corresponds with an equal-legs projection and Fibonacci extension levels, making it an important reference point for the current Litecoin price analysis.
A decline into this region would not automatically establish a reversal. Instead, the market would need to show evidence of demand returning around those levels. A sustained break below the zone could leave LTC exposed to the $40 area, which has already acted as an important base during the recent decline.
The previous $46 neckline is now particularly important from a technical perspective. Reclaiming that level would begin to repair the damaged four-hour structure. Until then, rebounds toward $46 may encounter selling pressure.
Litecoin Attempts to Form a Bottom
The bearish setup is being balanced by signs that Litecoin may be approaching the later stages of its broader decline.
An analysis from ew-forecast noted that LTC recently reached new lows near $40 during a five-wave bearish impulse. The subsequent stabilization has raised the possibility of a bottoming structure. The analysis described the move as a potential “signal for the bottom formation,” while stressing that additional confirmation is still required.
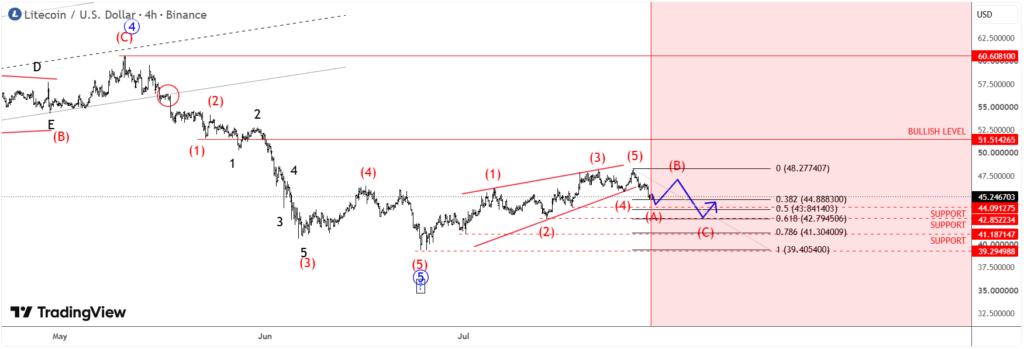
The recovery from the lows has also shown some constructive characteristics. According to the analysis, Litecoin may be developing a leading diagonal structure, which can appear near the beginning of a larger reversal.
However, that interpretation does not rule out another pullback. The analysis suggests that a corrective ABC move could take LTC back toward the $42–$41 region before a more sustained recovery attempt develops.
That distinction is important for an LTC prediction. A move toward $41–$42 would not necessarily invalidate a longer-term bottoming thesis, but it would keep short-term downside risks elevated.
Technical Indicators Keep LTC Under Pressure
The latest TradingView readings reinforce the cautious outlook. Litecoin’s composite technical summary is Neutral overall but heavily tilted toward Sell signals, with 16 Sell readings, nine Neutral readings and only one Buy.
The moving-average picture is more clearly negative. The 10-period EMA stands at $46.21 and the 10-period SMA at $46.62, both above the current price. The 20-period EMA and SMA are positioned at $45.88 and $45.89, respectively, while the 30-period EMA is $45.68.
The 50-period EMA is higher at $46.04, whereas the 50-period SMA at $44.51 is the only moving-average reading among the listed averages showing a Buy signal. This leaves LTC trading close to an important medium-term reference point.
Longer-term averages remain considerably higher. The 100-period EMA and SMA stand at $48.66 and $48.94, while the 200-period EMA is $56.04 and the 200-period SMA is $53.51. With price below these levels, the broader trend remains weak.
Momentum indicators are less decisive. The 14-period RSI is 47.23, keeping it near the midpoint rather than in oversold territory. Stochastic %K is 43.68, while Williams %R is -72.31.
Other readings show some downside pressure without signaling an extreme move. Momentum (10) is -1.83, Bull Bear Power is -1.03 and CCI (20) is -25.76. The ADX reading of 19.01 also indicates relatively limited trend strength.
The mixed oscillator readings suggest that Litecoin has not reached a technically oversold condition despite its recent decline. That leaves room for further weakness if sellers gain control of the low-$40s.
Key Litecoin Price Levels to Watch
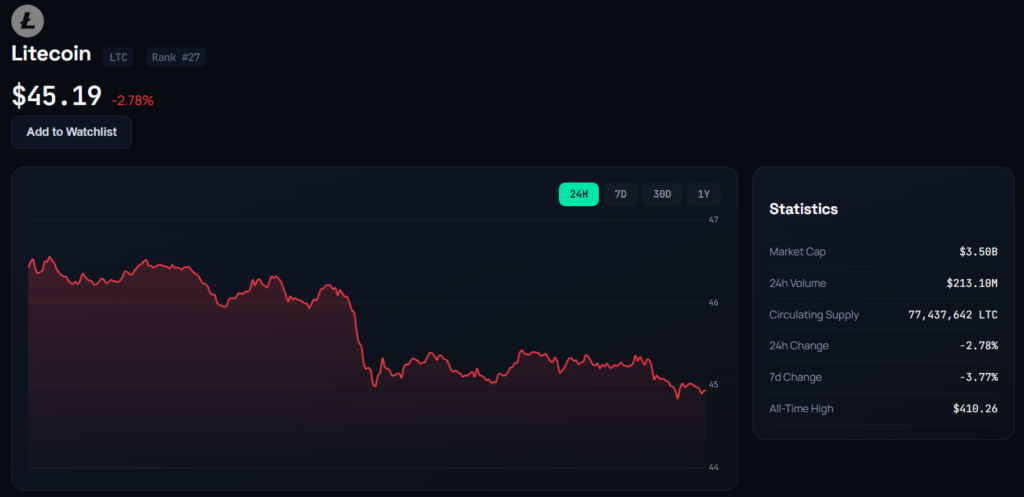
The central pivot point is around $44.45, putting the current Litecoin price close to a technically important threshold.
Above the market, the first major recovery hurdle remains around $46. A sustained reclaim of that level would place the $48–$50 region back on the radar. TradingView’s classic pivot framework places R1 at $49.60, followed by R2 at $57.32.
The $49–$50 region therefore represents a more meaningful confirmation area for bulls than a brief move above $46. A sustained break above it would put LTC back above several important short- and medium-term averages and could materially improve the technical structure.
On the downside, the $44.30–$42.80 area is the immediate zone to monitor. The $42–$41 region is another important reference based on the potential corrective structure identified by ew-forecast.
TradingView’s classic pivot calculations place S1 much lower at $36.73, with S2 at $31.58. These levels are not immediate targets but illustrate how downside risk could expand if the current support structure fails.
LTC Price Prediction: What Comes Next?
Litecoin’s loss of its four-hour ascending trendline has shifted the short-term setup toward caution. The $44.30–$42.80 area is now the first major test for buyers, while the $42–$41 region could become important if the decline extends.
A defense of these levels followed by a recovery above $46 would offer the first evidence that buyers are rebuilding momentum. A move through the $49–$50 resistance area would provide stronger technical confirmation by placing LTC above several key moving averages.
Conversely, continued trading below $46 would leave the market vulnerable to another test of the low-$40s. A decisive breakdown through that region could undermine the emerging bottoming thesis and expose Litecoin to lower support levels.
For now, the technical evidence does not establish a confirmed major bottom. As ew-forecast noted, “more price data and a stronger impulsive recovery” are needed before such a conclusion can be made. That leaves the current LTC price prediction balanced between a possible base near $40–$42 and the risk of further losses if buyers fail to defend support.

Jack Spencer is a financial journalist and crypto market analyst covering digital assets, blockchain innovation, and global market developments. His reporting focuses on cryptocurrency price trends, regulation, institutional adoption, and the evolving digital asset ecosystem.
View all stories by Jack Spancer →