 BTC
BTC  ETH
ETH  USDT
USDT  BNB
BNB  XRP
XRP  USDC
USDC  SOL
SOL  TRX
TRX  FIGR_HELOC
  ZEC
ZEC  HYPE
HYPE  DOGE
DOGE  XMR
XMR  USDS
USDS 
Litecoin (LTC) Price Prediction: LTC Reclaims $47 as Bulls Target $52 After Defending Key $40 Support
Litecoin has recovered toward $47 after defending the $40 area, putting the focus back on whether buyers can extend the rebound toward the $50-$52 resistance zone.


The latest move has improved Litecoin’s short-term technical structure, although the broader trend remains more cautious. Market data shows LTC trading around $47.04 on August 20, after rising 5.43% on August 19 from $44.31 to $46.76.
The recovery is significant because the $40 region has emerged as an important long-term demand area. However, reclaiming $47 alone does not establish a lasting trend reversal. Bulls still need to overcome several resistance levels before the broader bearish structure can be considered materially weaker.
Major Support Continues to Hold
Litecoin’s recent decline brought the price into a historically important support region near $40.30, while the latest analysis in the supplied market reports identifies a low around $39.28. That area is therefore an important reference point for the current LTC price prediction.
The market structure described in the source analysis is consistent with a potential accumulation phase. Litecoin previously recorded a selling climax around $40.52 before rebounding toward an automatic rally near $46.36. It subsequently swept earlier lows in a spring formation and recovered back into the range.
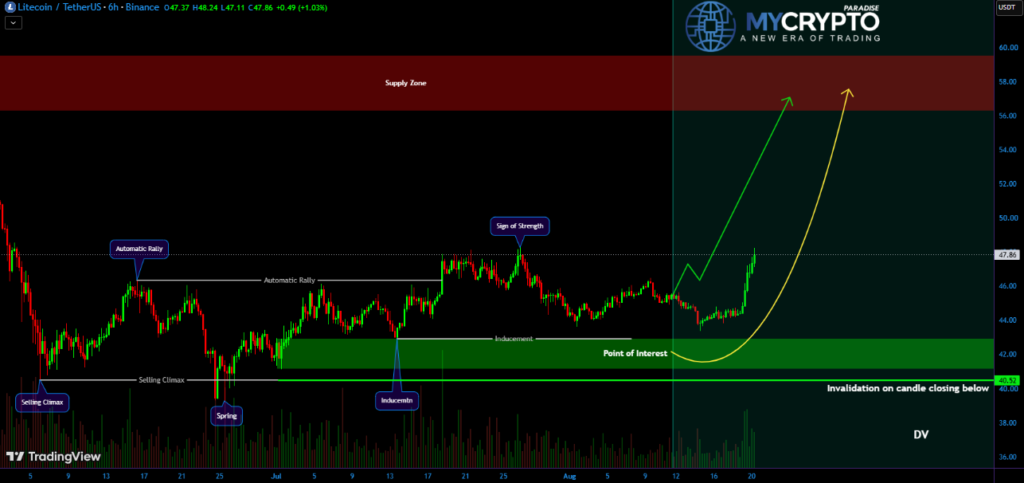
The latest move above the $46.36 automatic rally level is particularly relevant. The supplied technical analysis characterizes that breakout as a sign of strength, suggesting that demand has become more active after the prolonged decline.
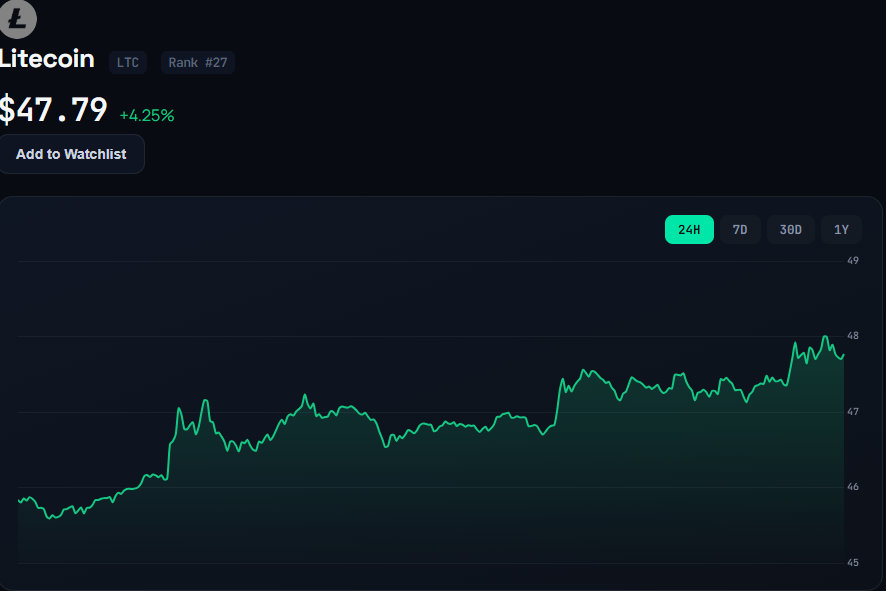
Price action since then has reinforced the short-term recovery. LTC/USDC on Binance was reported at $47.04 on August 20, with an intraday range of $46.79-$47.26.
Still, $40-$40.50 remains the key structural line for the bullish case. A decisive break beneath that region would undermine the accumulation interpretation and reopen the possibility of a deeper correction.
$50-$52 Is the First Major Obstacle
The immediate challenge for Litecoin is no longer simply reclaiming the mid-$40s. Bulls now need to establish acceptance above the $50-$52 zone.
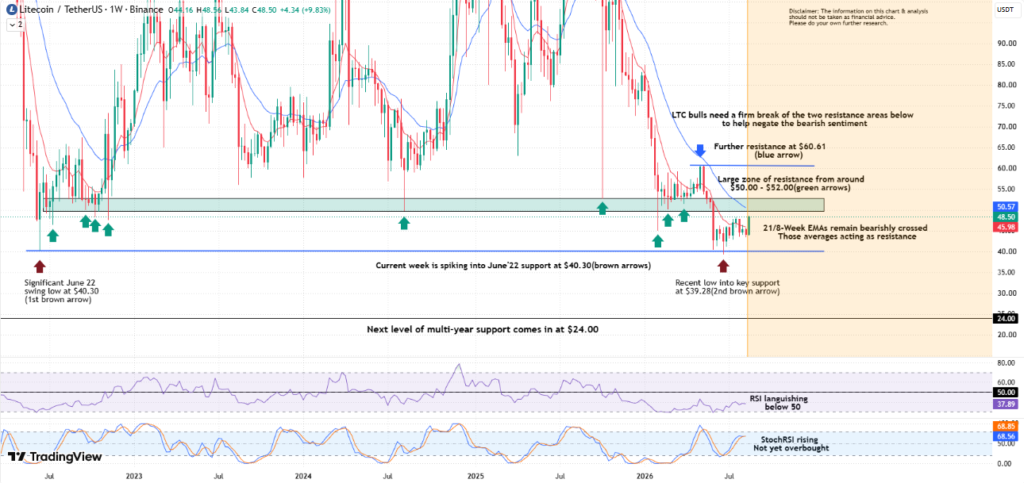
The supplied analysis identifies $50-$52 as a major multi-year resistance area that has previously functioned as both support and resistance. This makes the zone more important than a simple round-number target.
A move toward $52 would represent a meaningful continuation from current levels. From $47.04, a rise to $52 would amount to approximately 10.5%. But reaching the level and breaking through it are two different technical events.
For the bullish scenario to strengthen, traders would ideally want to see sustained closes above the zone rather than a brief intraday spike. Expanding volume would provide additional confirmation that demand is supporting the breakout.
The short-term indicator picture is also improving. The supplied TradingView-based analysis describes the current technical summary as Buy, with oscillators collectively leaning bullish and shorter-term moving averages supporting the recovery. At the same time, the one-week and one-month readings remain “Sell,” showing that the rebound has not yet completely reversed the higher-timeframe trend.
This divergence is important for any Litecoin forecast. Short-term momentum can improve while the broader market structure remains bearish.
Further Resistance at $60.61
A successful breakout above $50-$52 would remove the first major obstacle, but Litecoin would still face resistance near $60.61.
That level is considerably above the current market and would require a sustained change in momentum. The supplied analysis notes that a firm break above both $50-$52 and $60.61 would be needed to materially weaken the broader bearish structure.
The $56.28-$59.56 area is also identified in the supplied accumulation analysis as a major supply zone and potential draw on liquidity. This creates a notable resistance cluster between the upper-$50s and approximately $60.60.
Consequently, the path toward $60 is unlikely to be technically straightforward. Even if LTC clears $52, sellers could become active again as the price approaches the high-$50s.
Moving Averages Remain Bearish
Despite the recent recovery, Litecoin’s longer-term trend indicators remain a constraint.
The supplied analysis notes that the 21/8-week exponential moving averages remain bearishly crossed and are positioned as resistance above price. The weekly RSI also remains below 50, although rising StochRSI indicates that short-term momentum is beginning to recover.
This combination gives the current Litecoin price analysis a mixed character.
On shorter timeframes, buyers have gained momentum. TradingView’s aggregated technical framework also shows a Buy reading for the current timeframe, while its moving-average group is described as strongly constructive. However, the weekly and monthly ratings remain Sell.
That means the current move should be viewed as a recovery attempt rather than a confirmed long-term trend reversal.
A sustained move above $50-$52 would provide stronger evidence that the balance is shifting. Until then, resistance from longer-period averages remains a significant consideration.
Litecoin Halving Adds a Longer-Term Supply Catalyst
The next Litecoin halving is another factor investors are watching as the market approaches 2027.
Litecoin’s protocol reduces the mining reward by half every 840,000 blocks. The next halving is expected around July 2027 at block 3,360,000, reducing the block reward from 6.25 LTC to 3.125 LTC.
The event will reduce the rate at which new Litecoin enters circulation. However, a halving should not automatically be treated as a guaranteed price catalyst. Historical market performance shows that supply reductions can interact with broader liquidity, demand, and investor sentiment in different ways.
For the current LTC prediction, the halving is therefore better viewed as a longer-term structural factor rather than a direct explanation for the latest move toward $47.
In Summary
Litecoin is attempting to build on its recovery from the $40 area after successfully defending a major long-term support region.
The move above the previous $46.36 Automatic Rally level has improved the short-term structure, while current market data places LTC near $47.04.
The next major test is $50-$52. A sustained breakout above that zone would strengthen the bullish case and could bring the $56.28-$59.56 supply area and $60.61 resistance into focus.
However, the broader trend has not yet fully turned bullish. Weekly and monthly technical readings remain cautious, while the 21/8-week EMA structure continues to provide overhead resistance.
On the downside, the $40-$40.52 region remains the key invalidation area for the current accumulation thesis. A decisive loss of that support would weaken the recovery structure and could expose Litecoin to substantially lower levels.
For now, the most important question in this Litecoin price prediction is whether buyers can convert the recovery above $47 into a sustained breakout through $50-$52. Until that happens, the market remains in a recovery phase rather than a confirmed new uptrend.

Riva A. Nahar joins our team as a Crypto Journalist, covering cryptocurrency markets, blockchain developments, DeFi, and emerging trends across the digital-asset industry. With a focus on clear, accurate, and well-researched reporting, Riva brings a balanced perspective to fast-moving crypto news and market developments. Her work aims to make complex industry developments accessible while maintaining strong journalistic standards.
View all stories by Riva A. Nahar →