 BTC
BTC  ETH
ETH  USDT
USDT  BNB
BNB  XRP
XRP  USDC
USDC  SOL
SOL  TRX
TRX  FIGR_HELOC
  ZEC
ZEC  HYPE
HYPE  DOGE
DOGE  XMR
XMR  USDS
USDS 
Litecoin (LTC) Price Prediction: LTC Rebounds From $40 Support as Bulls Target a Break Above $60
Litecoin is showing renewed strength after bouncing from the $40 support zone, with buyers now pushing toward $60 as a decisive level that could shape the next phase of the LTC price trend.


The recovery has carried LTC back above $50 and improved short-term momentum after weeks of weakness. However, the broader market structure remains cautious, leaving bulls with several technical hurdles to overcome before the rebound can be viewed as a confirmed trend reversal. Sustained buying pressure, stronger volume, and a successful break above $60 would provide more convincing evidence that Litecoin is moving into a broader recovery phase.
Litecoin Reclaims the $50 Area
LTC has moved decisively higher after spending much of August near its recent lows. Binance data reviewed for August 21 shows Litecoin trading around $51.28 after opening at $47.83 and reaching an intraday high of $51.28. That represented a 7.24% daily gain. The move followed consecutive advances of 5.45% on August 19 and 2.18% on August 20.
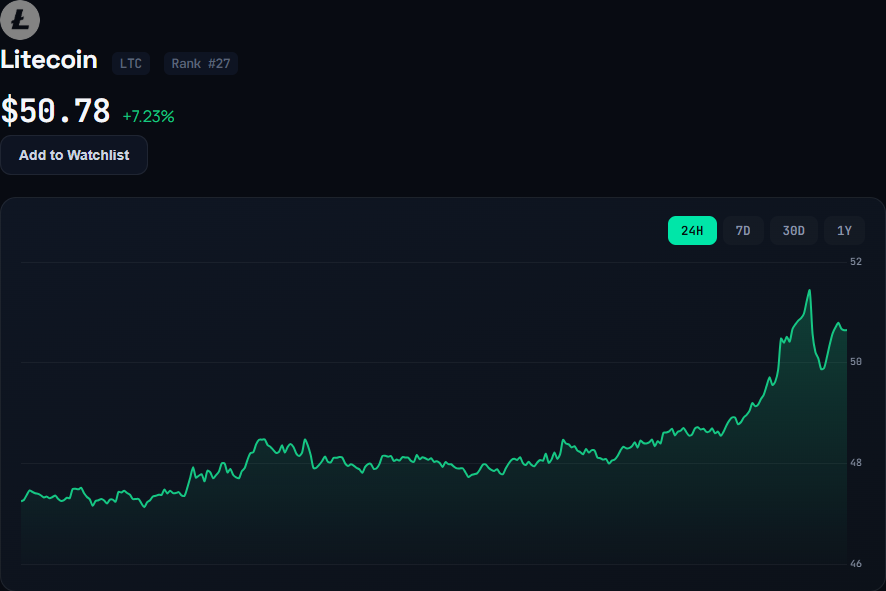
The price action places the 40-45 zone at the center of the current Litecoin price analysis. LTC reached a recent low near 43.79-44.15 during August 16-18 before buyers returned. From the August 18 low near $44.15 to the August 21 high, Litecoin gained roughly 16%.
That recovery is significant technically, but it does not, by itself, establish a new long-term uptrend. Litecoin remains well below its 2021 record high, while longer-term performance metrics continue to show substantial losses.
$60 Remains the Key Resistance
The next major hurdle for LTC is the 50-52 region, followed by the more important $60 resistance area.
A move through $52 would give buyers evidence that the latest rebound is developing beyond a short-lived relief rally. However, a sustained daily close above $60 would carry greater significance because that level has acted as a major overhead barrier in the recent trading structure.
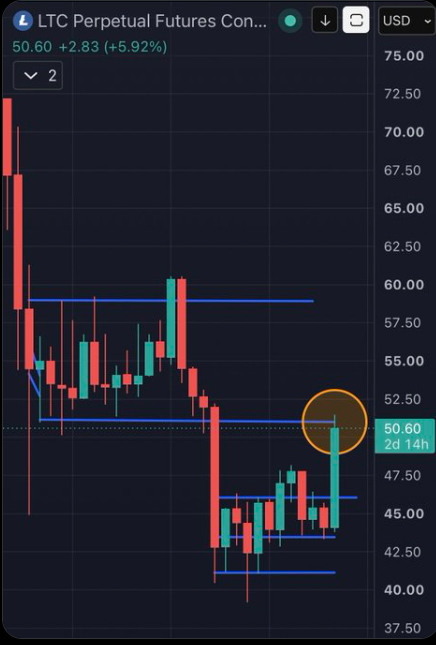
The technical setup therefore leaves Litecoin with a relatively clear path in the short term: maintain the reclaimed 45-50 region, push through $52, and then challenge $60. Failure at those levels could send the price back toward the recent support zone.
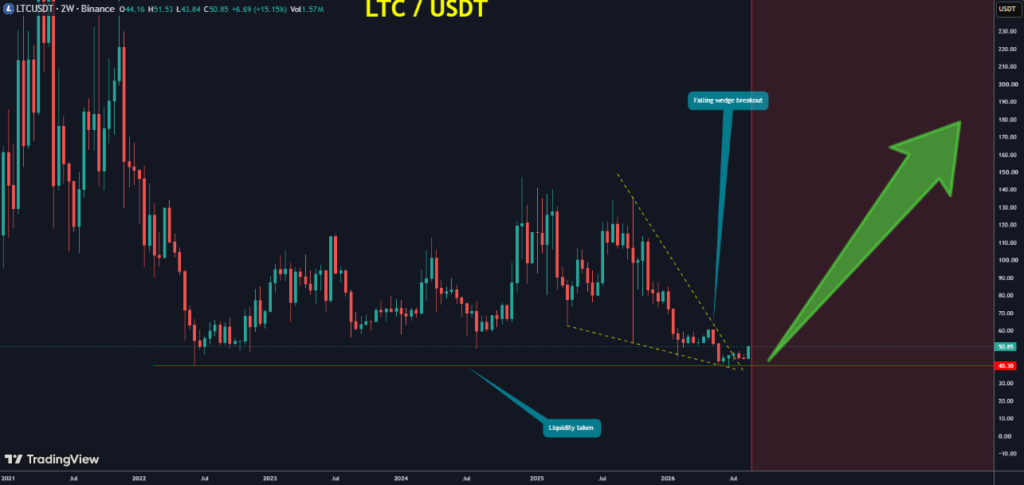
One market analysis of the LTC/USDT chart described the asset as having broken out of a falling-wedge structure and highlighted the importance of holding above the recent low. The analysis also noted that resistance was expected near the current trading range, with a stronger move potentially following a decisive breakout.
Technical Indicators Show a Mixed Picture
The latest technical evidence does not point to an unqualified bullish reversal.
TradingView’s LTCUSDT technical framework combines moving averages, oscillators, and pivot levels to produce an overall market signal. Its published analysis also stresses that technical ratings can change quickly and should not be treated as standalone trading signals.
The source technical report supplied for this analysis showed a bullish short-term bias, particularly from moving averages, while the oscillator group leaned neutral-to-buy. That combination is consistent with Litecoin’s recent rebound: price momentum has improved, but the market has not yet established a durable higher-timeframe trend.
The RSI is particularly important after a move of this size. A reading above 70 would indicate that short-term momentum has entered traditionally overbought territory, increasing the possibility of consolidation. Conversely, a failure by RSI to confirm new price highs could create bearish divergence and weaken the breakout case.
MACD, Stochastic RSI, Williams %R, Commodity Channel Index, and the Awesome Oscillator should therefore be monitored alongside price rather than interpreted independently.
The moving-average structure is equally important. A sustained move above the 50-period and eventually the 200-period averages would provide stronger evidence that Litecoin is transitioning from recovery to trend reversal. Until that happens, the current advance can reasonably be viewed as a short- to medium-term recovery within a broader weak market structure.
$40 Support Remains the Line to Watch
The $40 area has emerged as a critical reference point in the latest Litecoin price prediction.
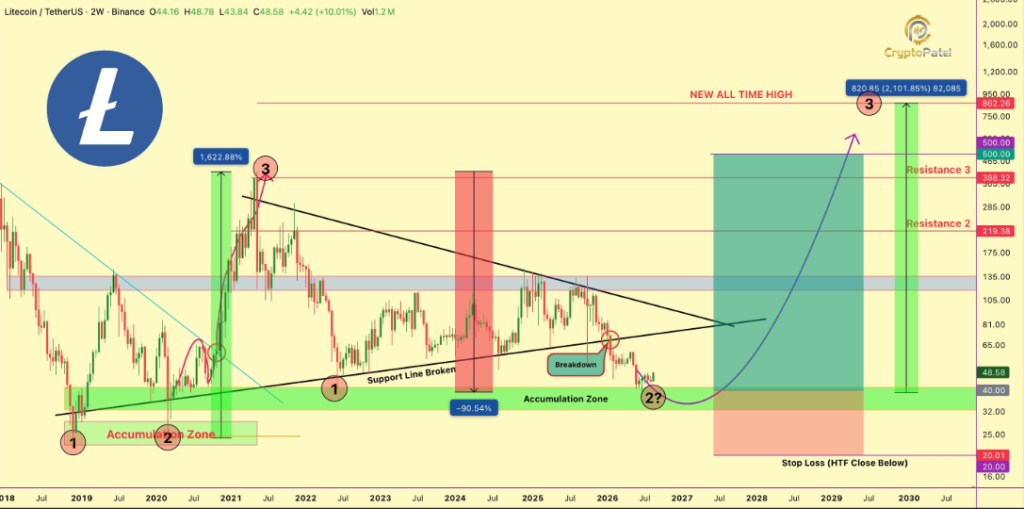
The supplied chart analysis identifies the zone as a major accumulation and long-term trend-support area. Litecoin’s rebound from the low-$40s gives that level additional technical relevance, although support is never guaranteed to hold on a future retest.
A daily or weekly close back below the recent support structure would weaken the bullish case. It could indicate that buyers failed to convert the rebound into a sustained recovery and potentially reopen the path toward lower levels.
For bulls, the more constructive scenario is continued consolidation above $45 followed by a successful reclaim of 50-52. That would establish a higher low and give the market a stronger foundation for another attempt at $60.
Litecoin ETF Adds a New Market Factor
The current Litecoin forecast also has a market-structure element that was less prominent during previous cycles: regulated investment products providing direct exposure to LTC.
Canary Capital’s Litecoin ETF, ticker LTCC, is designed to provide exposure to the price of Litecoin by holding LTC, according to the fund’s official materials. As of August 6, 2026, the trust reported approximately 126,715 LTC in its holdings and net assets of about $5.73 million.
The ETF does not guarantee higher LTC prices, but its existence gives traditional brokerage and retirement-account investors another mechanism for gaining price exposure without directly managing Litecoin wallets or private keys.
That makes ETF flows a factor worth watching alongside spot-market volume. Strong inflows could potentially improve demand, while weak or declining assets would provide less support for the bullish thesis.
Litecoin Halving Remains a Longer-Term Catalyst
The next Litecoin halving is currently projected for around July 2027. Litecoin’s protocol reduces the block reward by half every 840,000 blocks. The next event is expected to reduce the reward from 6.25 LTC to 3.125 LTC per block.
The halving is important because it reduces the rate at which new LTC enters circulation. However, the event itself does not automatically produce a price increase. Market demand, liquidity, broader cryptocurrency conditions, and investor expectations will determine how the reduced issuance affects Litecoin’s value.
For the current LTC price prediction, the 2027 halving is therefore better viewed as a longer-term supply-side factor rather than a direct explanation for the immediate rebound from $40.
What the LTC Price Prediction Shows
The immediate technical picture has improved considerably following Litecoin’s move from the low-$40s to above $50.
A sustained break above $52 would strengthen the recovery structure, while a confirmed move above $60 would represent a more meaningful technical development. Beyond $60, traders would likely begin assessing whether Litecoin can build a sequence of higher highs and higher lows rather than simply extending a short-term bounce.
On the downside, $45 is the first area to monitor, followed by the $40 region. A return below those levels would materially weaken the current bullish setup.
Longer-term Litecoin projections remain considerably more uncertain. Historical-cycle comparisons have been used by some analysts to argue for much larger upside targets, but those projections depend on assumptions that cannot be established from the current chart alone. Litecoin’s previous cycles also occurred under different liquidity, market structure, and regulatory conditions.
For that reason, the most evidence-based Litecoin prediction at present is narrower: LTC has recovered strongly from important support, momentum has improved, and $60 is the next major technical test. Whether that rebound develops into a sustained trend reversal will depend on volume, market-wide conditions, and the ability of buyers to defend newly reclaimed levels.

Riva A. Nahar joins our team as a Crypto Journalist, covering cryptocurrency markets, blockchain developments, DeFi, and emerging trends across the digital-asset industry. With a focus on clear, accurate, and well-researched reporting, Riva brings a balanced perspective to fast-moving crypto news and market developments. Her work aims to make complex industry developments accessible while maintaining strong journalistic standards.
View all stories by Riva A. Nahar →