 BTC
BTC  ETH
ETH  USDT
USDT  BNB
BNB  XRP
XRP  USDC
USDC  SOL
SOL  TRX
TRX  ZEC
ZEC  FIGR_HELOC
  HYPE
HYPE  DOGE
DOGE  LINK
LINK  XMR
XMR 
Litecoin (LTC) Price Prediction: LTC ETF Boosts Outlook as $64 Retest Puts $68 in Focus


Litecoin (LTC) has moved into a key technical area after recovering from its September lows and pushing above the $63–$64 region. The move has shifted attention toward whether the former resistance zone can now function as support.
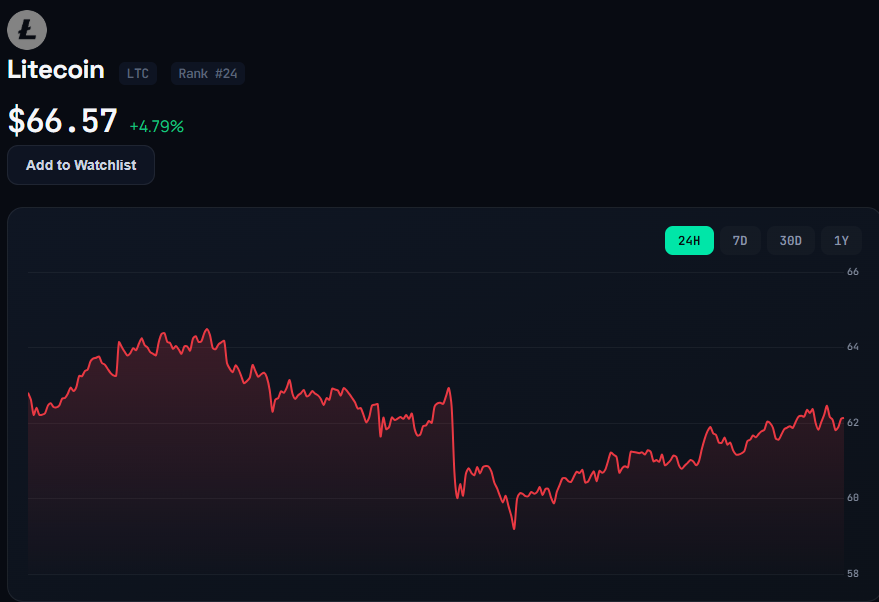
At the time of the latest market snapshot, Litecoin price was trading around $66.8, according to the supplied 4-hour chart analysis. The September recovery has lifted the cryptocurrency from a low near $50.50 on September 16, giving the current move considerably more momentum than the preceding consolidation.
The immediate question for the LTC price prediction is therefore not simply whether Litecoin can reach $68. Instead, traders are watching whether the market can successfully defend the recently reclaimed $63.80–$64.50 area.
Litecoin Retests Former Resistance
The latest price structure shows Litecoin breaking above the congestion zone around $63–$64.50 before moving toward the upper $60s.
A retest of that area is important because a previous resistance level can become support after a confirmed breakout. However, a single move above resistance does not by itself establish a durable trend change.
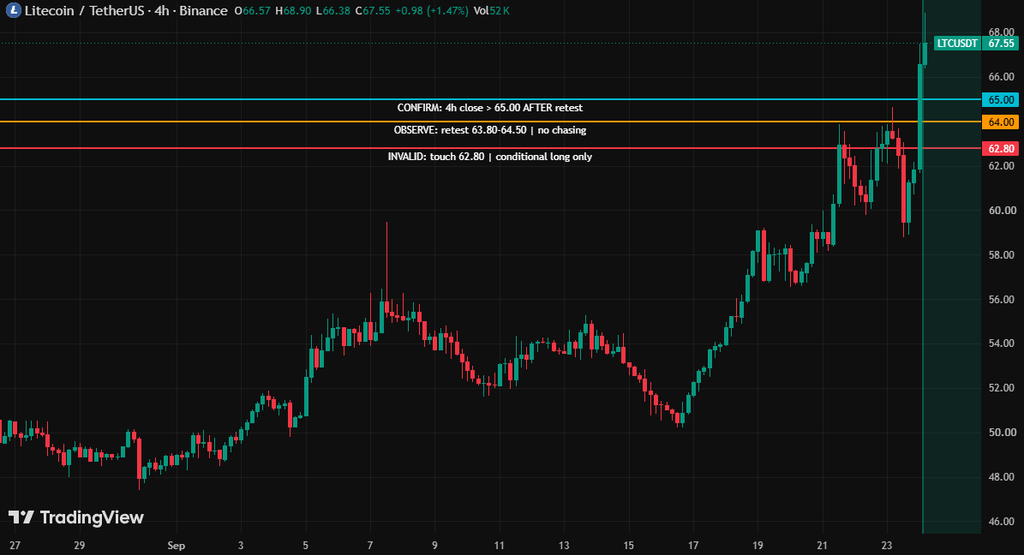
The supplied analysis identifies $63.80–$64.50 as the main observation zone. A sustained hold above this region would provide stronger evidence that the breakout is being accepted by the market.
The distinction matters. A large green candle demonstrates strong buying during that period, but it does not independently prove that support has formed.
$68 Becomes the Immediate Litecoin Price Target
With LTC trading near $66.8, $68 is now the nearest psychological level attracting attention in the short-term Litecoin price analysis.
The $68 area should be treated as a technical reference rather than a confirmed historical resistance level. If buyers maintain control above the $64 region, a move toward $68 would represent the next test of the recovery.
Conversely, failure to hold the reclaimed zone could send LTC back toward lower support levels. That would make the recent breakout less convincing and potentially return the market to a range-bound structure.
This makes the reaction around $64 more informative than the initial breakout itself.
Litecoin Price Analysis: Momentum Improves, but Signals Remain Mixed.
The supplied TradingView technical overview for LTCUSDT on Binance shows a neutral aggregate reading in its primary indicator tables. At the same time, the platform’s explanatory material describes a stronger daily technical reading, while the one-week timeframe has a buy-oriented reading, and the one-month timeframe remains on the sell side.
Shorter timeframes can improve considerably while the longer-term structure remains weaker. As a result, the recent rally should be viewed as a developing recovery rather than evidence that Litecoin has already established a new long-term uptrend.
The technical overview also does not provide numerical readings for several major oscillators in the displayed tables, including RSI, Stochastic, CCI, ADX, and MACD. Therefore, precise indicator values should not be inferred from the neutral summary alone.
Moving Averages Offer Additional Context
The supplied technical data shows that the primary moving-average tables did not display numerical values for the listed EMA and SMA periods. However, the accompanying technical summary describes the moving-average component as strongly positive.
That creates another timeframe distinction. A recovery above shorter-term averages can support improving momentum, while longer-term averages may continue to reflect the weakness of the preceding decline.
For LTC, sustained closes above important short-term averages would therefore provide more useful confirmation than a single intraday move.
Litecoin’s Recovery From September Lows
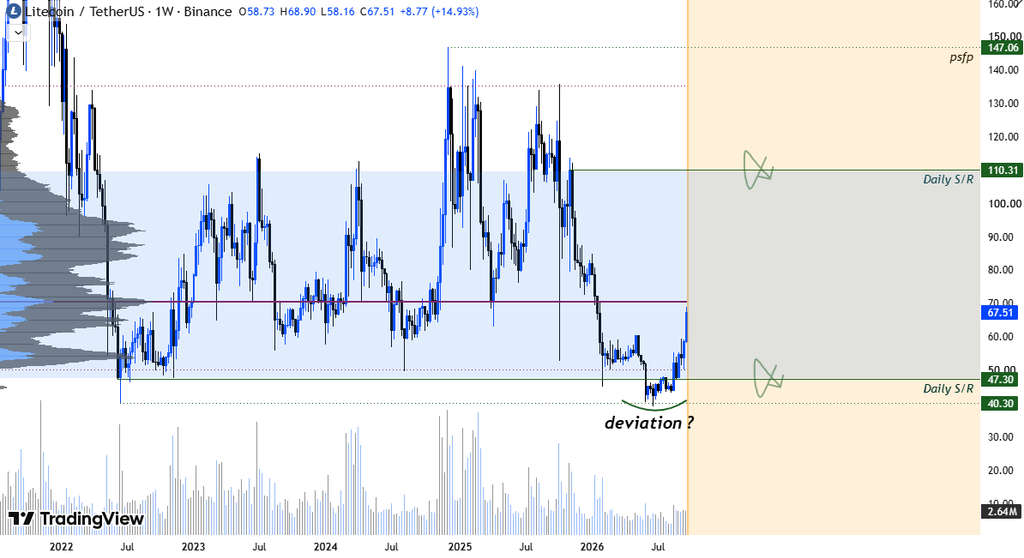
LTC fell toward approximately $50.50 on September 16 before beginning a sustained recovery. From that point, the cryptocurrency advanced through the low-$60s and eventually challenged the upper-$60s.
The recovery has also occurred alongside periods of relatively strong daily price movement. The supplied market data indicates that weekly gains have moved above the 15%–20% range during some recent observations.
Still, percentage gains over a short period can increase volatility. A rapid advance can be followed by consolidation or a pullback even when the broader structure remains constructive.
For that reason, the behavior around $64 is arguably more significant than the size of the preceding rally.
Litecoin ETF Adds a Broader Market Context
Canary Capital’s official materials identify LTCC as a vehicle designed to provide exposure to Litecoin’s price by holding LTC. SEC filings also document the existence and reporting of the Canary Litecoin ETF.
This does not establish a direct reason for the latest price movement. ETF-related products can broaden the ways investors obtain market exposure, but price remains determined by overall supply, demand, liquidity, and market conditions.
Therefore, the ETF development is better viewed as part of Litecoin’s broader market infrastructure rather than a standalone explanation for the $64–$68 setup.
Litecoin Halving Remains a Longer-Term Supply Factor
The Litecoin halving is another structural factor investors monitor, but it doesn’t immediately explain the current price action.
Litecoin’s protocol reduces the block reward every 840,000 blocks. The most recent halving occurred in August 2023, reducing the reward from 12.5 LTC to 6.25 LTC. The next halving is expected around 2027, when the reward is scheduled to fall to 3.125 LTC. The precise date depends on actual block production.
Because the next halving remains well beyond the current trading window, it should not be treated as a short-term catalyst for a move toward $68.
Instead, it is relevant to the longer-term Litecoin forecast because the protocol’s issuance rate is programmed to decline over time.
What the $64 Level Means for LTC
A successful retest would strengthen the argument that the previous resistance area has transitioned into support. In contrast, a decisive move back below the region would weaken that interpretation.
The supplied chart analysis places particular attention on a close above $65 following a retest. This is a condition within the original technical setup, not confirmation that such a move will occur.
The distinction is important because crypto markets can briefly move above or below a level before reversing.
Litecoin Price Prediction: What to Watch Next
For the immediate LTC price prediction, three areas stand out:
- $63.80–$64.50: The main retest and potential support zone.
- Around $65: A confirmation area identified in the supplied technical setup.
- $68: The next short-term upside reference.
If LTC holds the $64 area and continues producing higher closes, attention could remain focused on $68. A sustained move through that level would then require fresh price discovery and additional technical confirmation.
On the other hand, losing the reclaimed support area would weaken the current breakout structure and could bring lower levels back into focus.
The evidence therefore supports monitoring price confirmation rather than assuming that the breakout will automatically continue.
Litecoin Forecast Remains Dependent on Confirmation
In the short term, the recovery from approximately $50.50 toward the upper-$60s has improved the market structure. The $64 retest will help determine whether that improvement can hold.
On a broader timeframe, however, the mixed technical readings indicate that Litecoin has not eliminated all signs of longer-term weakness. The daily and weekly technical picture is more constructive than the monthly signal described in the supplied data.
That makes the $64–$68 range an important testing ground for the next phase of Litecoin’s price action.
For now, the key question is whether buyers can defend the former resistance zone. A successful hold would keep the $68 level in focus, while a failure around $64 would raise questions about the durability of the latest breakout. As with any technical projection, these levels describe possible market scenarios rather than guaranteed outcomes.

Riva A. Nahar joins our team as a Crypto Journalist, covering cryptocurrency markets, blockchain developments, DeFi, and emerging trends across the digital-asset industry. With a focus on clear, accurate, and well-researched reporting, Riva brings a balanced perspective to fast-moving crypto news and market developments. Her work aims to make complex industry developments accessible while maintaining strong journalistic standards.
View all stories by Riva A. Nahar →