 BTC
BTC  ETH
ETH  USDT
USDT  BNB
BNB  XRP
XRP  USDC
USDC  SOL
SOL  TRX
TRX  ZEC
ZEC  FIGR_HELOC
  HYPE
HYPE  DOGE
DOGE  LINK
LINK  XMR
XMR 
Zcash Price Analysis: ZEC Eyes $1,800 After Explosive September Rally
Zcash (ZEC) has emerged as one of the standout performers in the crypto market this month, extending a powerful rally that has taken the privacy-focused asset from below $1,000 to above $1,500.


After briefly approaching $1,570, the Zcash price has entered a period of consolidation, leaving traders focused on whether the next major move could take the token toward $1,800.
The latest pullback has not yet broken the broader bullish structure. However, ZEC is now trading near several key resistance levels, while momentum indicators suggest the market is becoming increasingly stretched.
Zcash Rally Loses Some Momentum Near $1,600
ZEC’s September advance has been unusually strong. The token closed near $953 on September 3 before breaking through the $1,000 area and accelerating higher. By September 16, it had reached around $1,337, followed by another surge that carried the price above $1,500.
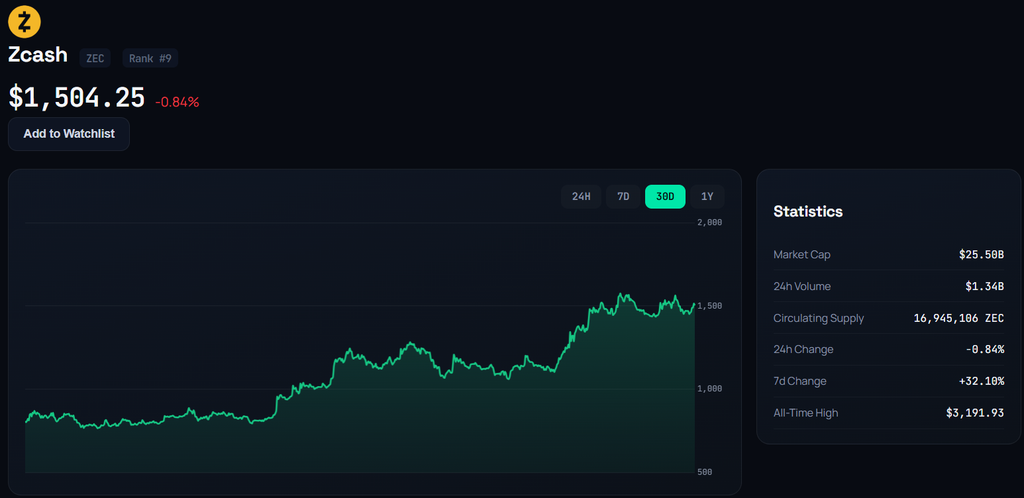
Market data showed Zcash reaching roughly $1,570 during the latest trading session before retreating toward the $1,460-$1,490 area. Despite the short-term decline, the token remained substantially higher over both the seven-day and 30-day periods.
The sharp rise has also changed the technical structure. Levels that previously acted as resistance are now being monitored as potential support, while the market has entered a relatively thin area above the recent highs.
This makes the $1,600 region particularly important for the next stage of the Zcash price move.
Bullish Pennant Breakout Still Shapes the Outlook
The latest rally followed a prolonged bullish pennant formation. Technical analysts had been monitoring the pattern as ZEC compressed beneath resistance, with the subsequent upside break producing a rapid move through several previously identified targets.
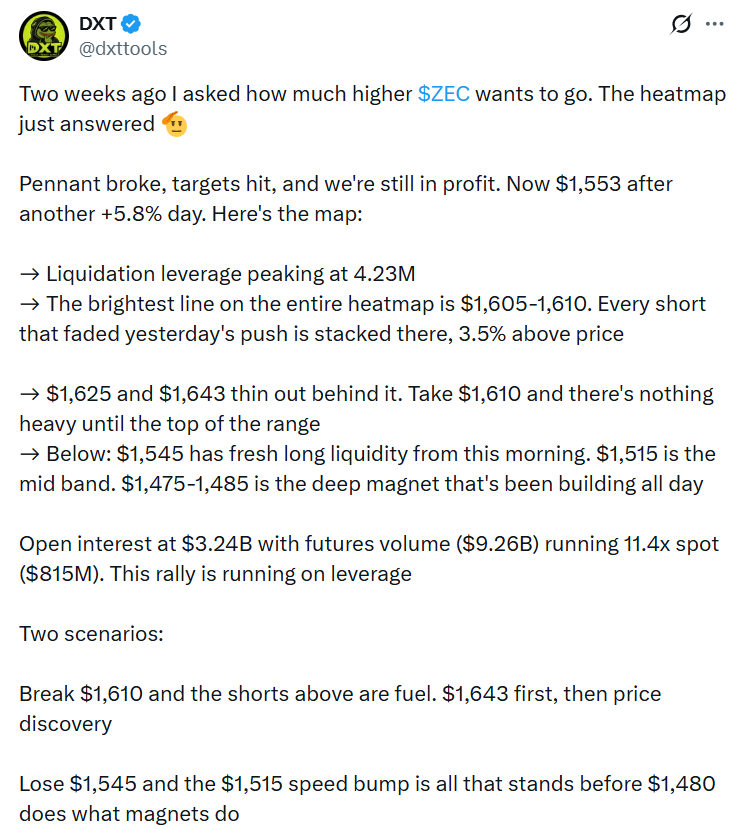
Crypto analyst @dxttools highlighted the breakout after Zcash reached approximately $1,553 following a 5.8% daily gain. The move had already surpassed earlier objectives associated with the formation.
The significance of the pattern now depends on whether Zcash can maintain the gains achieved after the breakout. A successful retest of the breakout area could provide the foundation for another upward leg, while a sustained move back into the previous trading range would weaken the setup.
The $1,800 area is therefore better viewed as a potential extension target rather than a confirmed destination.
$1,600 Becomes the Next Major Test
The immediate technical challenge sits above the current consolidation range.
Recent analysis places resistance around $1,560-$1,585, an area that combines recent highs with the upper portion of the daily Bollinger Band structure. A sustained daily close above this region would provide clearer confirmation that buyers are attempting to resume the broader advance.
Beyond that zone, $1,600-$1,615 represents another significant hurdle.
The liquidation heatmap cited in the analysis shows substantial short liquidity concentrated around $1,605-$1,610, followed by thinner liquidity around $1,625 and $1,643. If Zcash moves through these levels while leveraged short positions remain exposed, the resulting liquidations could contribute to additional short-term volatility.
A sustained move beyond $1,615 would leave $1,700 as an important intermediate reference before the market approaches the $1,800 area.
Momentum Indicators Show an Extended Market
The underlying trend remains strong across several technical measures.
ZEC is trading well above its major moving averages. The 10-day averages are positioned around $1,360-$1,387, while the 20-day averages are closer to $1,230-$1,250. The longer-term 50-day, 100-day, and 200-day averages remain considerably lower.
This wide separation demonstrates how quickly the market has moved during September. It also means that the token could experience a sizeable pullback without immediately reversing its longer-term trend.
The daily MACD remains positive, while the ADX reading around 57 in the cited analysis points to a strong existing trend. The Ichimoku structure and SuperTrend indicator are also positioned below the current market price.
Together, these signals support the existence of a strong uptrend, although they do not establish the direction of the next individual trading session.
Overbought Conditions Could Bring Consolidation
The strongest caution in the current setup comes from the shorter-term momentum indicators.
The daily RSI has moved into the upper 60s, while the Stochastic oscillator is above 80. The Commodity Channel Index is also above +100, and Williams %R is close to the upper end of its range.
Such readings are consistent with an extended rally. They can remain elevated during strong trends, but they also indicate that the market has moved quickly and may require a period of consolidation.
Recent price action already shows signs of this adjustment. After closing around $1,562 on September 18, ZEC recorded a daily decline before recovering and subsequently moving lower again. The repeated swings around the $1,500 region indicate elevated volatility rather than a smooth continuation higher.
For bulls, holding the recent breakout structure becomes increasingly important.
$1,450 Support Could Define the Near-Term Trend
On the downside, the first area to monitor is approximately $1,430-$1,450.
This region coincides with recent lows and sits close to the lower portion of the current consolidation. A successful defense could allow buyers to rebuild momentum before another attempt at the $1,560-$1,600 resistance band.
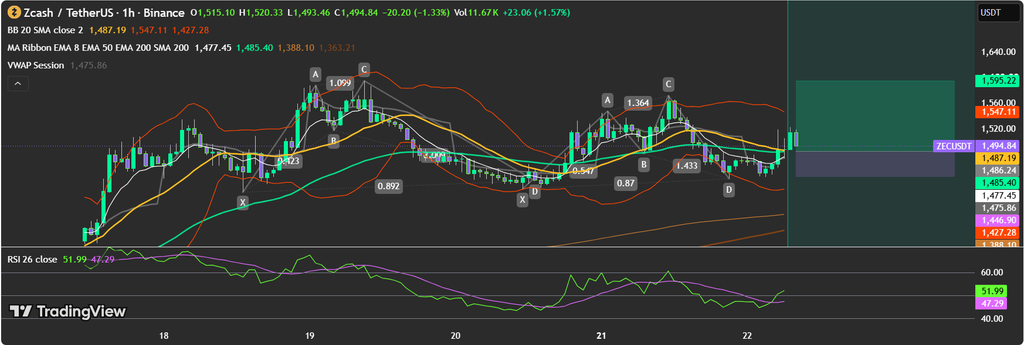
A decisive move below approximately $1,434 would provide a warning that the latest advance is losing short-term strength. The next significant technical area would then sit around $1,230-$1,250, where the 20-day moving averages are currently positioned.
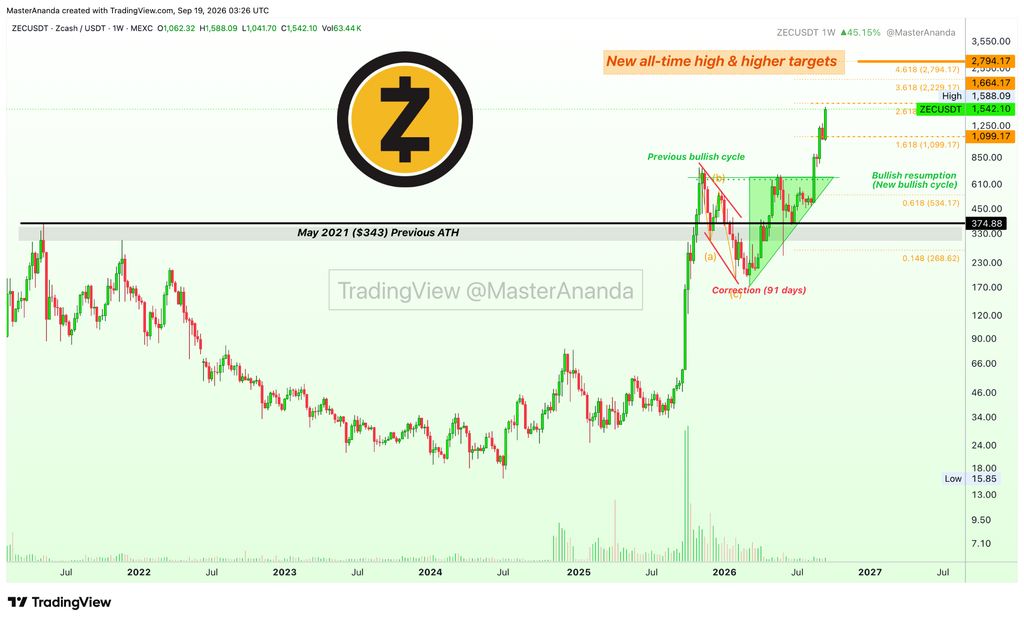
There is also a deeper support region between $1,050 and $1,100. That area is particularly notable because previous price action identified the $1,100 region as a significant Fibonacci extension and structural level.
The distance between the current price and these lower zones highlights the scale of ZEC’s September advance.
What Would Need to Happen for $1,800?
For ZEC to establish a clearer path toward $1,800, the market would first need to overcome the resistance cluster around $1,560-$1,615.
A daily close above the upper portion of that range would strengthen the breakout structure. Follow-through toward $1,700 would then become the next technical milestone, with $1,800-$1,850 representing the broader upside zone identified by recent technical projections.
However, the sequence matters. A move directly toward $1,800 without establishing support above the current resistance could leave the market vulnerable to another sharp reversal.
The opposite scenario would involve rejection below $1,600 followed by a break beneath $1,430-$1,450. Such a move would increase the possibility of a deeper retracement toward the $1,230-$1,250 moving-average area.
ZEC’s Next Move Depends on Breakout Confirmation
Zcash enters the next phase of its rally with a strong multi-week trend but increasingly stretched short-term indicators.
The bullish pennant breakout remains an important part of the technical picture, while the distance above major moving averages confirms how dramatically the market has accelerated. At the same time, resistance between $1,560 and $1,615 has yet to be decisively cleared.
A sustained move through that region would put $1,700 and potentially $1,800 back into focus. Failure to break higher, particularly if accompanied by a loss of the $1,430-$1,450 support zone, would instead shift attention toward lower retracement levels.
For now, the $1,600 area remains the key battleground. ZEC’s ability to establish acceptance above that region may provide a clearer indication of whether the September rally is entering another expansion phase or moving into a longer consolidation period.

Julia Thornton is a cryptocurrency reporter covering blockchain, digital assets, and financial technology. She reports on market developments, regulation, exchange activity, and industry trends, delivering timely and accurate coverage of the global crypto ecosystem.
View all stories by Julia Thornton →