 BTC
BTC  ETH
ETH  USDT
USDT  BNB
BNB  XRP
XRP  USDC
USDC  SOL
SOL  TRX
TRX  ZEC
ZEC  FIGR_HELOC
  HYPE
HYPE  DOGE
DOGE  XMR
XMR  WBT
WBT 
Hyperliquid (HYPE) Price Prediction: Whale Accumulation Builds as Traders Watch Rally Beyond $200
Hyperliquid (HYPE) is attracting renewed market attention as large-wallet accumulation, protocol buybacks, and a developing technical structure converge around several important price levels.


While $210 has emerged as a long-range technical target in some chart analyses, Hyperliquid price must first navigate resistance around $89.59, $110, $130, $160, and the $170-$180 region.
Large HYPE Purchases Put Whale Activity in Focus
Recent on-chain transactions have added a fundamental layer to the HYPE market narrative. Lookonchain has been tracking wallet 0x6436, which has repeatedly accumulated large amounts of Hyperliquid rather than making a single isolated purchase.
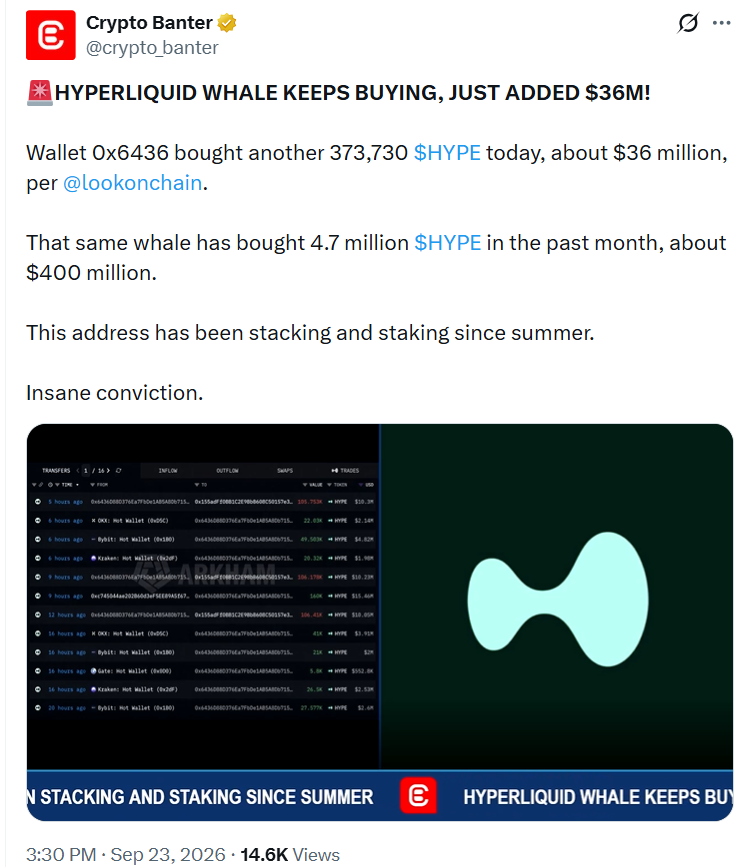
The wallet bought 308,569 token for approximately $26 million in September, taking its holdings to roughly 4.05 million HYPE at the time. Lookonchain also reported that the accumulated tokens were staked.
Earlier transactions show a similar pattern. The same address purchased 141,442 HYPE worth approximately $11.88 million on September 1 and another 243,713 HYPE worth about $20.24 million on August 30. Additional purchases between August 25 and 27 brought further exposure through several trading venues.
Repeated accumulation can be significant when assessing market positioning, but wallet activity should not be interpreted as proof that Hyperliquid will rise. The purpose and investment horizon behind a large address remain important considerations.
Recent reports have linked 0x6436 with PURR, a publicly traded company developing a HYPE treasury strategy. Its regulatory disclosures describe plans to acquire and deploy HYPE as part of its broader strategy around the Hyperliquid ecosystem.
That context changes how the transactions can be interpreted. Instead of necessarily representing short-term whale speculation, some of the buying may reflect a longer-duration corporate treasury allocation.
Technical Structure Points to Several Resistance Zones
HYPE’s chart structure has become another important part of the market discussion. TradingView analyst WESLAD has identified $72-$82 as an immediate demand region where buyers could attempt to defend the recent structure if price retreats.
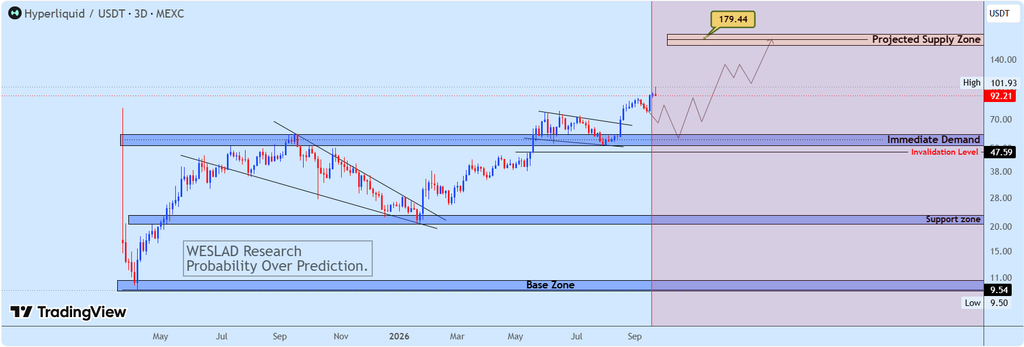
The analysis identifies $89.59 as an important upside threshold. A sustained move above that level could open a technical path toward $130, followed by the $170-$180 region described as projected supply. The chart also highlights $176.22 as a specific level within that zone.
The downside framework is equally important. WESLAD identifies $68.34 as the immediate level that would invalidate the current bullish setup. A deeper move below $47.59 would put the broader higher-timeframe structure under greater pressure.
Another technical setup places a deeper demand area around $52-$59. That zone represents a potential reaction area in the event of a larger correction rather than a direct forecast of where HYPE must trade.
Taken together, the charts outline a sequence of technical checkpoints rather than a straight-line path toward higher prices.
Protocol Revenue Creates a Different Demand Dynamic
HYPE also has a distinctive tokenomics structure because trading activity on Hyperliquid is connected to the token’s buyback mechanism.
According to Hyperliquid’s official documentation, trading fees are directed toward community-related mechanisms, including the Assistance Fund. The fund converts relevant fees into HYPE, with purchased tokens subsequently burned.
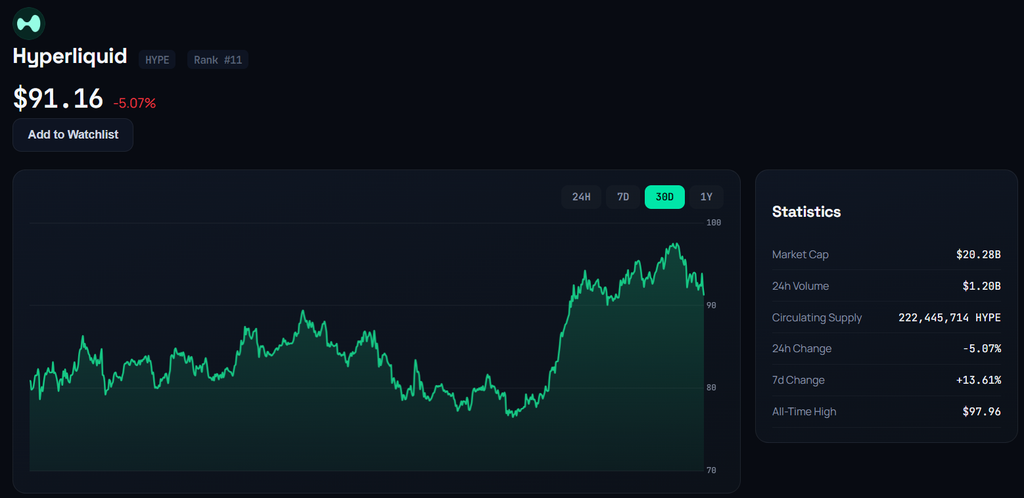
This mechanism means higher protocol activity can potentially translate into recurring HYPE purchases. Coinbase Institutional has also described Hyperliquid’s eligible protocol fees as being systematically directed toward HYPE buybacks, while noting that future token unlocks can influence the balance between buyback demand and new supply.
A regulatory filing provides additional context. It states that approximately $1.2 billion worth of HYPE has been bought back and retired since launch, with around 46.4 million token retired. That figure represents roughly 4.6% of the token’s maximum supply.
The mechanism is notable, but buybacks should not be treated as a guaranteed price support. Market liquidity, selling pressure, token emissions, and changes in protocol activity can all influence the market price independently of the buyback program.
Binance Claims Need Confirmation
Exchange access has also become part of the latest HYPE discussion, particularly following social-media reports claiming a new Binance spot listing.
However, the distinction between a circulating market claim and an official exchange announcement is important. Binance’s official announcements reviewed through September 24 do not show a new global spot listing for HYPE. Recent spot-market announcements instead include assets such as ARB and ENA, along with tokenized-stock products.

Therefore, the reported HYPE listing should remain classified as unconfirmed until Binance publishes an official notice.
Hyperliquid already has exposure to Binance through derivatives markets, so a confirmed global spot listing could potentially broaden direct access to the token. The market impact, however, would depend on actual liquidity, trading participation, positioning, and the wider cryptocurrency environment.
For that reason, the listing narrative should be separated from the independently observable evidence surrounding HYPE’s on-chain accumulation and protocol economics.
Why $210 Is Appearing on HYPE Charts
The $210 figure is primarily a technical projection rather than a valuation derived from a fundamental model.
Trader @im_goomba previously outlined a potential parabolic phase for HYPE with a target around $210. An updated weekly chart identifies several intermediate resistance areas, including approximately $110 and $160, before the longer-term $210 zone.

That projection would require Hyperliquid to overcome several levels along the way. The first technical hurdle is the $89.59 area highlighted by WESLAD. A successful breakout could bring $130 into focus, while sustained strength beyond that level could place the $170-$180 supply region on the chart.
A move from those levels toward $210 would therefore require continued momentum and the preservation of higher lows. It would not be a single breakout event.
The opposite scenario also has defined reference points. A break below $68.34 would weaken the immediate bullish setup, while a decline through $47.59 would challenge the broader structure identified in the technical analysis.
Key HYPE Levels for Traders
Several price zones currently provide a framework for monitoring HYPE’s technical development.
Key HYPE levels include support at $47.59, $52-$59, and $72-$82, while $68.34 could weaken the bullish continuation setup. A breakout above $89.59 could target $110 and $130, followed by resistance at $160 and a projected $170-$180 supply zone, with $210 identified as the longer-range technical target.
The current HYPE setup combines several measurable factors, including repeated large-wallet purchases, protocol-linked token buybacks, and a series of technical resistance levels. These provide a factual basis for monitoring the market without establishing a predetermined price outcome.
The reported Binance spot listing remains a separate and unconfirmed catalyst. Until an official announcement appears, the more established variables are HYPE’s on-chain activity, Hyperliquid’s fee mechanics, and the token’s ability to maintain its technical structure.
For HYPE to approach the $210 projection, the market would need to clear the intervening resistance zones while preserving higher-timeframe support. The coming moves around $89.59, $130, and $170-$180 therefore remain important checkpoints for assessing whether the longer-term technical scenario is developing.

Jack Spencer is a financial journalist and crypto market analyst covering digital assets, blockchain innovation, and global market developments. His reporting focuses on cryptocurrency price trends, regulation, institutional adoption, and the evolving digital asset ecosystem.
View all stories by Jack Spancer →