 BTC
 ETH
 USDT
 BNB
 USDC
 XRP
 SOL
 TRX
 FIGR_HELOC
 ZEC
 HYPE
 XMR
 DOGE
 USDS

Litecoin (LTC) Price Prediction: $49 Support Holds as Technical Setup Points to Potential $55–$60 Move
Litecoin is holding above a key $49 support zone as LTC trades in the mid-$50s, leaving the market at a technical crossroads between further recovery toward $60 and renewed downside pressure.


Recent price action has improved from the deeper lows seen earlier in the year, but the broader trend has not fully reversed. Technical indicators show a constructive short-term setup, while longer-term signals remain more cautious. For traders assessing the latest LTC price prediction, the $49–$50 area is therefore becoming an important reference point.
Litecoin Price Analysis: Why $49 Matters
The most important development in the current Litecoin price analysis is the market’s reaction around $49.
A higher-timeframe chart analysis identifies a potential range deviation near that level. Price previously moved below the lower boundary of the broader range before recovering back above it. In technical analysis, such a move can indicate a failed breakdown if buyers subsequently establish acceptance above the former range low.
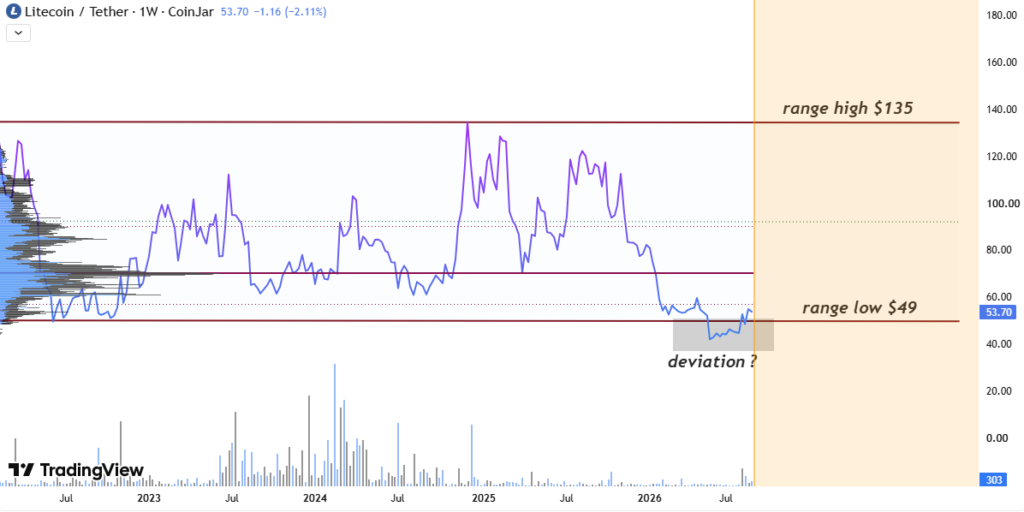
That interpretation remains conditional. A sustained move above $49 would keep the structure constructive, while a decisive return below the level would weaken the setup and expose Litecoin to lower support areas.
The difference between an intraday move and a confirmed breakdown matters. A brief move below support does not necessarily invalidate a broader structure; closing prices and subsequent acceptance are more meaningful when assessing a higher-timeframe range.
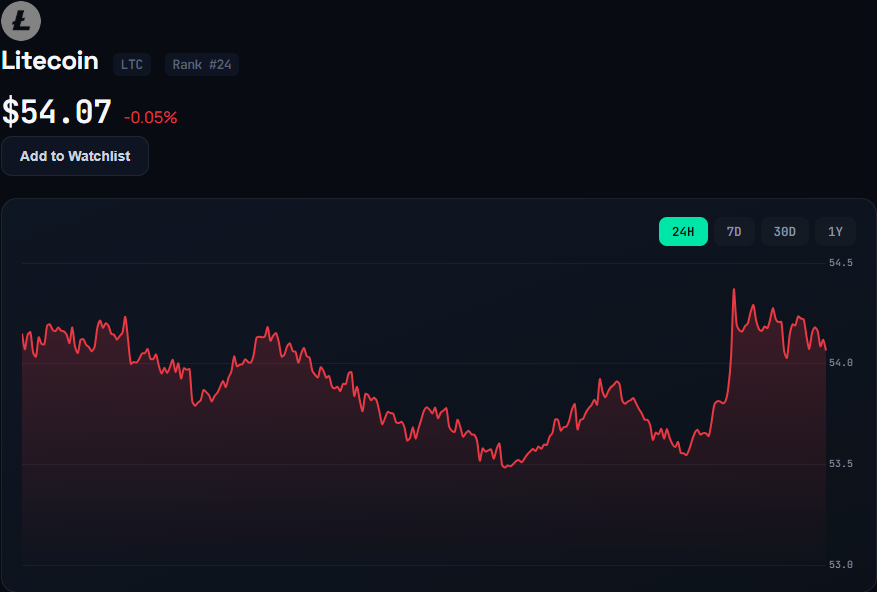
With LTC currently trading around $54, the cryptocurrency is several dollars above that structural threshold. CoinMarketCap data places Litecoin near $53.87, with a recent 24-hour range of approximately $52.93 to $54.22.
Technical Indicators Remain Mixed
The current LTC price prediction is not supported by one indicator alone. Instead, several technical measures point to improving short-term momentum, while longer timeframes continue to reflect the damage from the previous downtrend.
TradingView’s technical-rating framework has recently shown a strong-buy reading on the daily timeframe, although the weekly view has been more neutral and the monthly assessment has remained weaker. That divergence matters because it suggests the recent recovery has not yet become an unambiguous long-term reversal.
The 14-period Relative Strength Index (RSI) has generally been reported around the 60–62 area in recent technical snapshots. That places RSI above the midpoint but below the conventional 70 overbought threshold. In other words, momentum has strengthened without reaching an extreme level that would, by itself, indicate an overheated market.
Other oscillators have remained mixed. Stochastic readings have generally stayed in neutral territory, while MACD readings on shorter timeframes have shown signs of recovering momentum. This combination leaves room for additional upside, but it does not establish a guaranteed continuation.
Moving Averages Offer Short-Term Support
Moving averages have become another constructive component of the current Litecoin forecast.
Price has recently traded above several shorter-period averages, including the 10-, 20-, and 50-period measures in supporting technical snapshots. Such positioning generally indicates that short-term momentum has improved.
The longer averages tell a less straightforward story.
The 100- and 200-period averages continue to reflect the effects of Litecoin’s previous decline. In some technical configurations, the 50-day average remains below the 200-day average, a formation commonly associated with a longer-term bearish trend.
This creates an important distinction. Litecoin can maintain a bullish short-term setup while still remaining inside a broader recovery phase rather than a confirmed secular uptrend.
For that reason, a move above $55 would carry more technical significance if accompanied by sustained closes and stronger trading volume.
$55–$60 Becomes the Near-Term Test
If LTC continues to hold above $49 and maintains its recent momentum, the next area of interest is around $55.
Recent price action has repeatedly brought the market toward the mid-$50s, making that zone a practical test of whether buyers can extend the recovery. A clean break above the recent high area would shift attention toward $58 and potentially $60.
That does not mean $60 should be treated as a fixed target. Rather, it represents the next psychological and technical zone that could become relevant if resistance around $54–$55 is overcome.
Recent CoinMarketCap data shows LTC trading close to $54, while its seven-day range reported by CoinGecko extends from roughly $50.96 to $59.36. This illustrates how quickly volatility can expand once the market leaves its immediate consolidation area.
A sustained rejection around $55, however, would leave Litecoin vulnerable to another test of the lower support region.
What Happens If $49 Fails?
The bearish scenario is relatively straightforward.
If Litecoin loses $49 on a sustained basis and fails to reclaim the level, the range-deviation interpretation would become considerably weaker. Sellers could then attempt to push the price toward lower historical demand zones.
The $46–$48 region is particularly relevant because it has appeared repeatedly in recent technical discussions as an area where buyers previously showed interest.
A break below that zone would change the near-term structure again and make the recent recovery look more like a temporary rebound within a larger decline.
This is why the LTC price prediction around $55–$60 should not be considered independently of the $49 support level. The upside case depends heavily on the market continuing to defend the lower boundary of the structure.
Litecoin’s Longer-Term Picture
Despite the recent improvement, Litecoin remains far below its previous record.
CoinMarketCap currently lists Litecoin’s all-time high at $412.96, recorded in May 2021. At prices around $54, LTC remains roughly 87% below that peak.
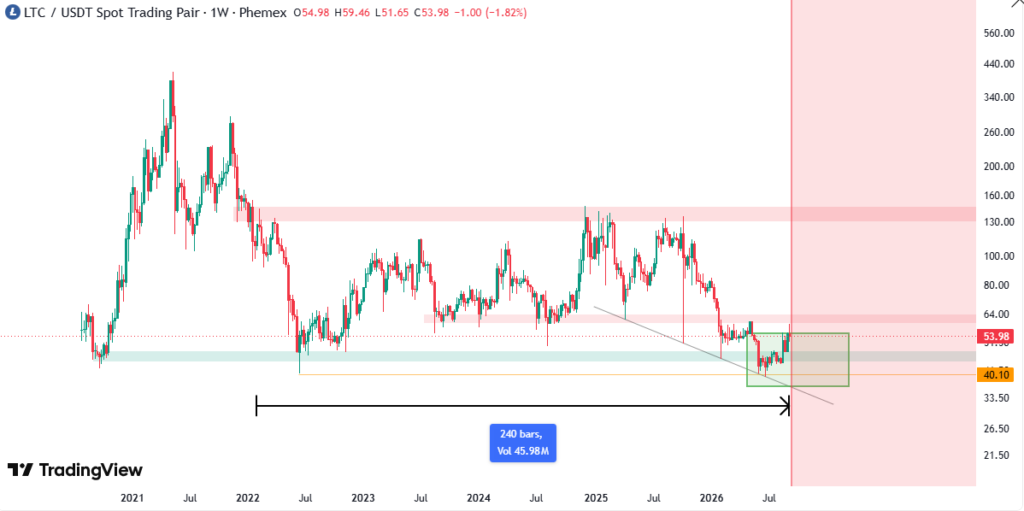
That historical gap is sometimes used to construct aggressive Litecoin predictions, but distance from an all-time high is not itself a valuation signal. A cryptocurrency does not automatically return to a previous peak simply because it has spent years below it.
Litecoin’s underlying monetary structure is more concrete. The network has a maximum supply of 84 million LTC, with block rewards reduced by half after every 840,000 blocks. The next scheduled reduction is expected around July 2027, when the block reward is projected to fall from 6.25 LTC to 3.125 LTC.
That supply schedule is relevant to Litecoin’s longer-term market structure, although it does not determine short-term price movements.
Litecoin ETF Adds Another Market Variable
The Litecoin ETF market also provides a newer channel for investors seeking exposure to LTC without directly holding coins.
Canary Capital’s LTCC product is designed to provide exposure to Litecoin’s price and holds LTC as its underlying asset. The issuer’s latest available information shows the product trading with Litecoin exposure and provides a regulated-market vehicle for investors who prefer an exchange-traded structure.
ETF flows should nevertheless be distinguished from spot-market technical signals. Increased institutional or regulated-market access can influence demand, but it does not guarantee that Litecoin will break a particular resistance level.
For the immediate LTC price today, technical price action remains the more direct measure of whether buyers or sellers are controlling the market.
Litecoin Forecast: What Traders Are Watching
The current Litecoin forecast can be divided into three technical scenarios.
Bullish case: LTC continues to hold above $49, establishes stronger support around the low-to-mid $50s, and breaks convincingly above $54–$55. In that scenario, $58 and $60 become increasingly relevant technical areas.
Neutral case: Litecoin remains between roughly $49 and $55, producing another period of range-bound trading while momentum indicators remain mixed.
Bearish case: LTC loses $49 and fails to reclaim it. Such a move would weaken the current range-deviation setup and could bring the $46–$48 support region back into focus.
This framework is more useful than assigning a single number to future Litecoin value because it accounts for the levels that would confirm or invalidate each scenario.
Bottom Line
Litecoin’s technical structure has improved, but the recovery is not yet conclusive.
The $49 level remains the key structural threshold. Holding above it keeps the recent deviation-and-reclaim setup intact and leaves room for a move toward $55, followed by $58–$60 if momentum strengthens and resistance is decisively cleared.
At the same time, the mixed weekly and monthly technical readings show why caution remains warranted. Litecoin is still substantially below its 2021 record, and longer-term moving averages continue to reflect the earlier downtrend.
For now, the most important signals are straightforward: $49 for structural support, $54–$55 for immediate resistance, and $58–$60 as the next potential upside zone. Whether LTC can turn that technical possibility into a sustained trend will depend on follow-through, volume, and subsequent daily closes rather than a single intraday move.
This article describes market conditions and technical scenarios and should not be interpreted as financial or investment advice. Cryptocurrency markets can move rapidly, and technical indicators can change as new price data becomes available.

Riva A. Nahar joins our team as a Crypto Journalist, covering cryptocurrency markets, blockchain developments, DeFi, and emerging trends across the digital-asset industry. With a focus on clear, accurate, and well-researched reporting, Riva brings a balanced perspective to fast-moving crypto news and market developments. Her work aims to make complex industry developments accessible while maintaining strong journalistic standards.
View all stories by Riva A. Nahar →