 BTC
BTC  ETH
ETH  USDT
USDT  BNB
BNB  XRP
XRP  USDC
USDC  SOL
SOL  TRX
TRX  FIGR_HELOC
  ZEC
ZEC  HYPE
HYPE  DOGE
DOGE  XMR
XMR  USDS
USDS 
Litecoin (LTC) Price Prediction: LTC Approaches $45 Resistance as Bullish Indicators Gain Momentum
Litecoin (LTC) is showing stronger short-term momentum as its price approaches the $45 resistance area, with technical indicators pointing to improving buying pressure.


The move comes alongside a bullish harmonic setup on the four-hour LTC chart, although broader timeframes continue to carry more cautious signals.
LTC was recently trading around $45.36, up about 2.21% on the day, with an intraday range of roughly $44.18 to $45.40. Historical data also shows that Litecoin has spent much of August consolidating around the mid-$40 area, keeping the $45 region as an important near-term technical reference.
For the latest LTC price prediction, the main question is whether buyers can convert the current momentum into a sustained move above resistance. While several daily indicators favor the bulls, longer-term technical readings remain less convincing.
Litecoin Price Analysis: Bullish Momentum Builds
The daily technical picture has strengthened considerably. The Relative Strength Index (RSI) stands at 74.179, placing it above the conventional 70 threshold associated with overbought conditions. While that reflects strong momentum, it also suggests that LTC could become vulnerable to a short-term pullback if buying pressure fades.
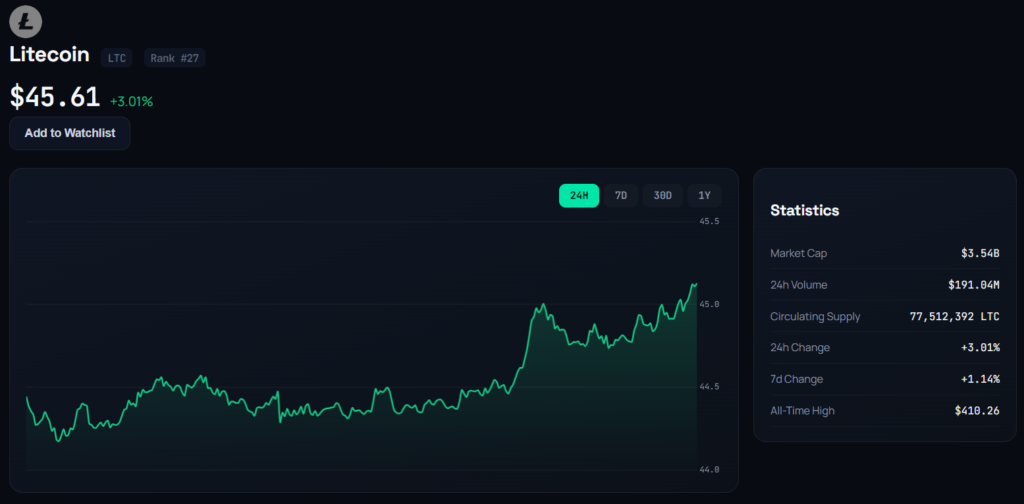
Other momentum indicators are similarly constructive. The Stochastic %K is at 63.107, while the Stochastic RSI Fast has reached 100. The MACD Level is positive at 0.16, and the Average Directional Index (ADX) stands at 42.261, indicating a relatively strong prevailing trend.
Additional readings reinforce the bullish short-term picture. The Williams Percent Range is at -2.041, the Commodity Channel Index (CCI) is 151.4021, the Ultimate Oscillator is 64.873, and the Rate of Change is 2.096. Bull/Bear Power is also positive at 0.642.
Taken together, these readings produce a strong-buy consensus among the cited daily oscillators. However, several of them are already in elevated or overbought territory, meaning momentum strength should not automatically be interpreted as unlimited upside potential.
LTC Price Tests $45 Resistance
The moving-average structure also favors buyers in the short term.
LTC is trading above the cited 5-, 10-, 20-, 50-, 100-, and 200-period moving averages. The 5-period SMA and EMA are positioned at $44.98 and $45.01, respectively, while the 10-period averages stand at $44.83 and $44.87.
Further down the moving-average ribbon, the 20-period SMA is $44.63, and its EMA is $44.72. The 50-period SMA and EMA are $44.53 and $44.56, while the 100-period readings are $44.40 and $44.52. The 200-period SMA and EMA both sit around $44.60.
This places the current LTC price above the entire cited moving-average group. The configuration provides short-term technical support beneath the market and indicates that recent price strength has pushed LTC above several commonly watched trend measures.
The next challenge is therefore around the $45 area rather than below it.
Litecoin Technical Levels to Watch
Classic pivot calculations put the central pivot at $44.96. Immediate support levels are located at $44.86, $44.77, and $44.67, while resistance levels are positioned at $45.05, $45.15, and $45.24.
This creates a relatively narrow technical band around the current price. A sustained move above $45.05 could bring $45.15 and $45.24 into focus, while a rejection could send LTC back toward the $44.96 pivot and the lower support levels.
The tight clustering of these levels makes price action around $45 particularly relevant for the near-term Litecoin price prediction.
LTC has also shown a tendency to trade within a relatively narrow range recently. Historical data shows several August sessions opening and closing around the 44-46 area, reinforcing the importance of a decisive move outside this range.
Bullish Crab Pattern Appears on 4H Chart
A separate technical setup is adding to the short-term bullish case.
CryptoNewton recently shared a Binance four-hour Litecoin perpetual futures chart identifying a bullish CRAB harmonic pattern. The setup had already reached its first target, or TP1, around $44.55, while the chart showed a normal entry area near $43.97.
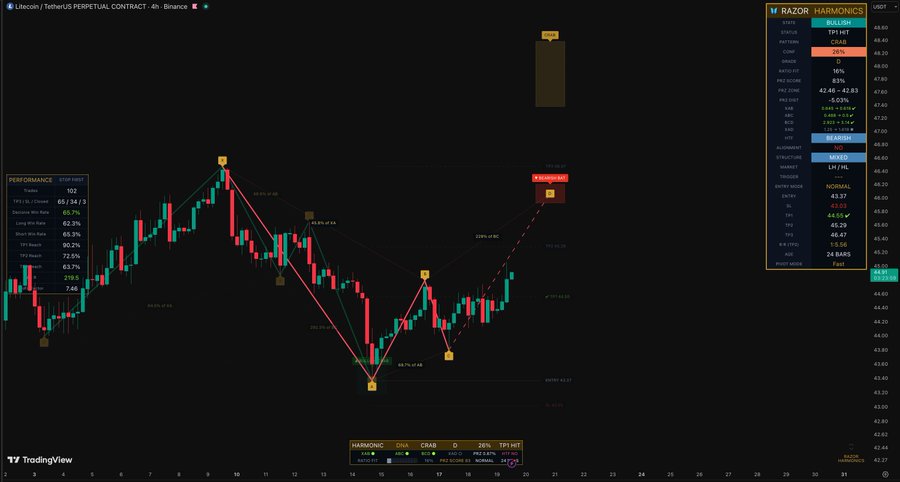
The analysis assigned the pattern a 26% grade and described the structure as mixed. It also referenced a 229% BC Fibonacci extension among the levels used to identify potential targets.
Harmonic patterns rely on specific price relationships and Fibonacci ratios to identify potential reversal or continuation zones. In this case, the pattern’s completion and subsequent move toward $45 suggest that buyers have already generated some follow-through.
However, the relatively low pattern grade and mixed structure are important qualifiers. The setup should therefore be treated as one technical input rather than confirmation of a broader bullish trend.
Broader LTC Outlook Remains Mixed
Despite the improving daily indicators, the wider Litecoin outlook is less definitive.
The TradingView LTCUSD summary was described as neutral on the daily view, while its one-week rating showed a prevailing sell trend, and its one-month rating indicated a sell signal. This creates a clear divergence between short-term momentum and longer-term trend readings.
That distinction matters for an LTC price prediction 2026. A strong daily move can occur within a broader consolidation or downtrend, particularly when the asset is approaching a well-defined resistance zone.
The current market structure therefore favors monitoring confirmation rather than assuming that the latest advance marks the beginning of a sustained rally.
What the LTC Price Prediction Shows Next
The technical picture currently gives buyers several advantages. LTC is above the cited moving averages, momentum indicators are broadly positive, and a bullish CRAB harmonic setup has already reached its first target.
At the same time, RSI at 74.179 and Stochastic RSI at 100 indicate that short-term momentum is stretched. The 45.05-45.24 resistance band is also immediately above the current market, creating a significant test for buyers.
A sustained break above this zone would strengthen the short-term bullish case and could shift attention toward higher resistance levels. Failure to clear it, however, could leave LTC vulnerable to a retreat toward the $44.96 pivot, followed by support around $44.86 and $44.77.
For now, the Litecoin price prediction remains cautiously constructive in the short term, but the broader trend has yet to provide the same level of confirmation. The most important signal may come from how LTC behaves around $45 and whether buyers can maintain the gains rather than simply test the resistance level.
Litecoin’s recent price history also shows why confirmation matters: the asset has repeatedly traded within the mid-$40 range, with previous August rallies failing to establish a lasting move higher.
The result is a market at a technical decision point. Short-term indicators favor the bulls, while higher-timeframe signals remain mixed to bearish. Until that divergence resolves, the $45 resistance zone remains the key level for assessing the next phase of LTC price action.

Julia Thornton is a cryptocurrency reporter covering blockchain, digital assets, and financial technology. She reports on market developments, regulation, exchange activity, and industry trends, delivering timely and accurate coverage of the global crypto ecosystem.
View all stories by Julia Thornton →