 BTC
 ETH
 USDT
 BNB
 XRP
 USDC
 SOL
 TRX
 FIGR_HELOC
 ZEC
 HYPE
 XMR
 DOGE
 USDS

Sui Price Prediction: SUI Risks Losing $0.90 Support as RSI Divergence Hints at a $1.00 Rebound
SUI remains under downward pressure as bearish technical indicators keep the token near a critical support zone around $0.90. Although bullish Relative Strength Index (RSI) divergence on the one-hour chart suggests selling momentum may be weakening, the broader market structure has yet to confirm a reversal.


Recent market data on October 25 placed SUI/USDT around $0.91–$0.94, following losses across shorter-term and weekly timeframes. The token’s next move could depend on whether buyers defend the current support area or sellers push the price toward lower levels.
Technical analysis presents two competing scenarios. A sustained breakdown below support could extend the correction, while a confirmed shift in market structure could open the way for a recovery toward $1.00. However, the bullish case remains conditional on price action rather than divergence alone.
SUI Price Prediction: Bearish Momentum Keeps $0.90 Support at Risk
SUI’s short-term chart structure remains bearish, with price repeatedly forming lower highs and lower lows. This pattern indicates that sellers continue to control the prevailing trend, despite occasional attempts at recovery.
The supplied TradingView technical summary also points to a broad sell bias across the daily, weekly, and monthly timeframes. Moving averages and momentum indicators largely favor the downside, although individual readings may vary between exchanges and chart intervals.
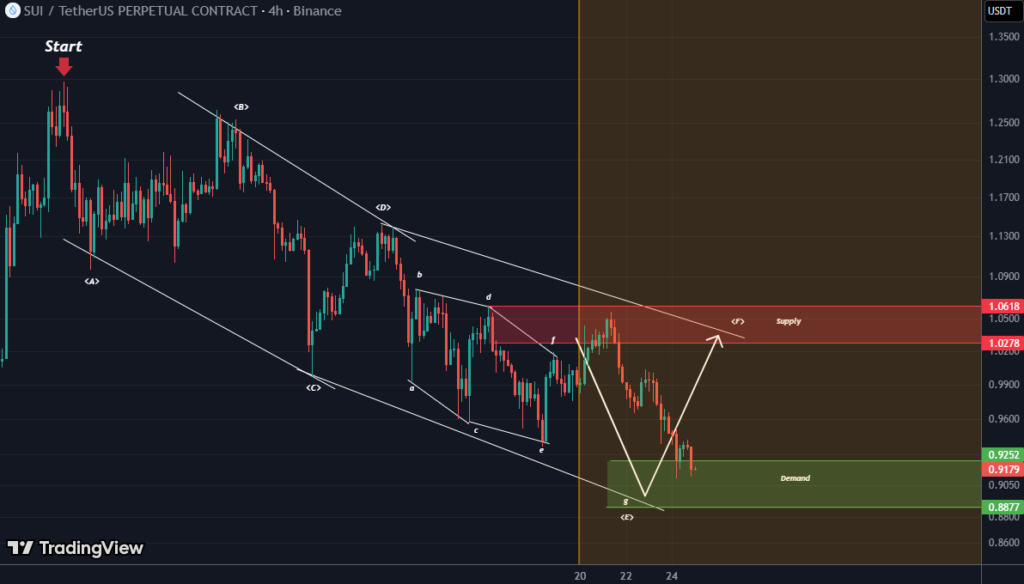
The analyst expects SUI’s bearish trend to continue toward the green support zone before a potential rebound, with price action confirmation needed for both short and long setups. Source: behdark/TradingView
On the four-hour chart, the Relative Strength Index has been reported around 30–34, placing momentum near oversold territory. The daily RSI is closer to 40. These readings indicate persistent weakness, but they do not establish that a market bottom has formed.
The Moving Average Convergence Divergence (MACD) indicator also remains negative on the four-hour and daily charts. Meanwhile, price is trading below several short- and medium-term moving averages, which may act as resistance during any recovery attempt.
The immediate support zone lies around $0.911–$0.913, while the broader $0.90 level remains an important psychological threshold. A sustained move below approximately $0.906 could expose the $0.879 area, followed by a potential test of $0.847.
These levels represent technical reference points, not guaranteed price destinations. A brief move below support followed by a rapid recovery would produce a different signal from a decisive breakdown confirmed by continued selling.
Bullish RSI Divergence Raises the Possibility of a Rebound
Despite the broader downtrend, the one-hour chart is showing a potential early sign of improving momentum. The supplied technical analysis identifies bullish RSI divergence alongside a possible double-bottom pattern near support.
Bullish RSI divergence occurs when price establishes a lower low while the RSI forms a higher low. This divergence can suggest weakening selling momentum, even as the asset continues to trade near its recent lows.
A double bottom, meanwhile, develops when price tests a similar support area twice and struggles to move lower. The pattern becomes more meaningful if buyers later push price above the intervening peak, confirming a potential shift in short-term market structure.
However, neither pattern guarantees a reversal. Divergence can persist while price continues to decline, and a suspected double bottom can fail if sellers regain control.
The supplied trade scenario identifies $0.9687 as a potential breakout-confirmation level, positioned above a previous lower high. A sustained move above this area would provide stronger evidence that the immediate bearish structure is weakening.
Until such a breakout occurs, the divergence should be treated as an early warning of potentially fading selling pressure rather than confirmation of a bullish trend.
SUI Price Prediction: Can Buyers Push the Token Back to $1.00?
The $1.00 level is the next major psychological reference point if SUI manages to recover from its current support zone. However, the token faces several resistance levels before a move toward that threshold can be considered technically established.
Initial resistance lies around $0.940–$0.964. This area overlaps with nearby price levels and short-term moving-average resistance, making it an important zone for assessing whether buying pressure is returning.
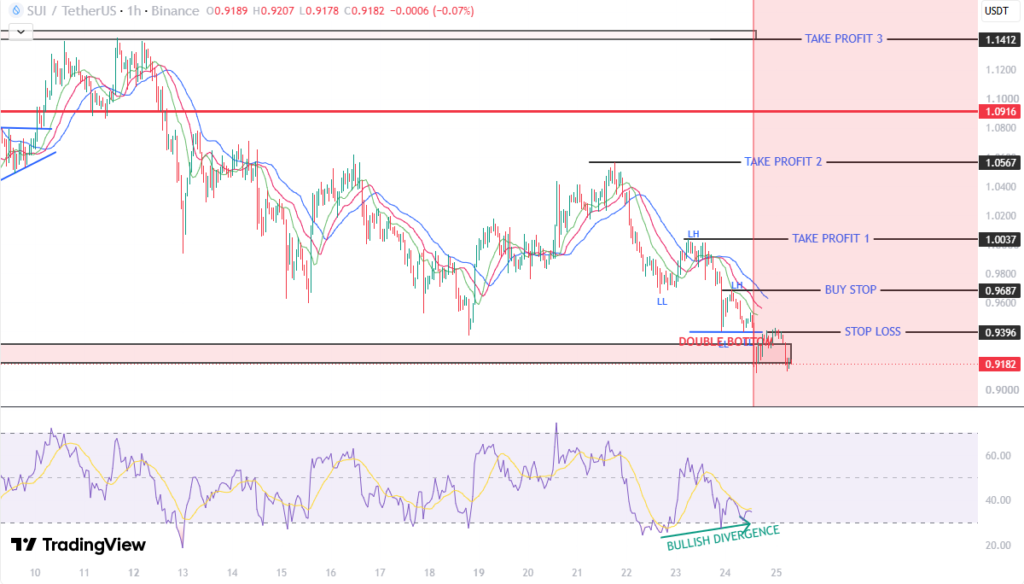
SUI shows potential for a bullish reversal toward $1.14, with 1-hour RSI divergence and a double bottom supporting a breakout above the $0.9687 entry level. Source: DanishQasim/TradingView
A stronger recovery would require SUI to move above $0.9687 and maintain upward momentum. The supplied technical plan places its first upside reference at $1.0037, followed by $1.0567. A higher level near $1.1412 is also identified, although reaching these levels would require additional confirmation and a sustained change in market structure.
The first target near $1.00 is therefore a conditional scenario rather than an established forecast. A rejection near $0.94–$0.97 would leave the bearish structure intact and could bring the $0.90 support area back into focus.
Conversely, a confirmed breakout followed by a successful retest of resistance as support would strengthen the case for a short-term recovery. Traders monitoring the SUI chart will need to distinguish between a temporary relief bounce and a broader reversal.
SUI Token Supply and Market Conditions Remain Relevant
Technical patterns are only one part of the SUI price outlook. Broader cryptocurrency market conditions, liquidity, trading volume, and changes in token supply can also influence price movements.
According to the official Sui token supply and schedule, SUI has a maximum supply of 10 billion tokens, with releases distributed over time. Scheduled token releases can increase the amount of SUI available in the market, although their actual price impact depends on demand, recipient behavior, and wider market conditions.
Market participants should also distinguish between network development and short-term token performance. Sui’s blockchain supports on-chain transactions, gas payments, staking, and governance-related functions, as outlined in its official tokenomics documentation. These utility features provide context for the asset but do not guarantee that its market price will rise.
The latest technical readings supplied for this analysis indicate weak momentum, with moving averages acting as overhead resistance and buying pressure remaining limited. A sustained recovery in trading activity would help assess whether demand is returning, while a decline on increasing volume could reinforce the bearish scenario.
Because indicator readings and market prices change continuously, traders and readers should verify current exchange data before concluding individual chart levels.
SUI Price Prediction: Key Levels to Watch
SUI’s immediate outlook hinges on whether buyers can defend the $0.90 area and overcome nearby resistance.
On the downside, a decisive break below approximately $0.906 could expose $0.879 and $0.847. These levels represent potential areas of interest if selling pressure accelerates.
On the upside, resistance around $0.940–$0.964 is the first obstacle. A sustained move above $0.9687 would provide a clearer signal of a potential short-term market structure shift, with $1.0037 serving as the first upside reference in the supplied technical plan.
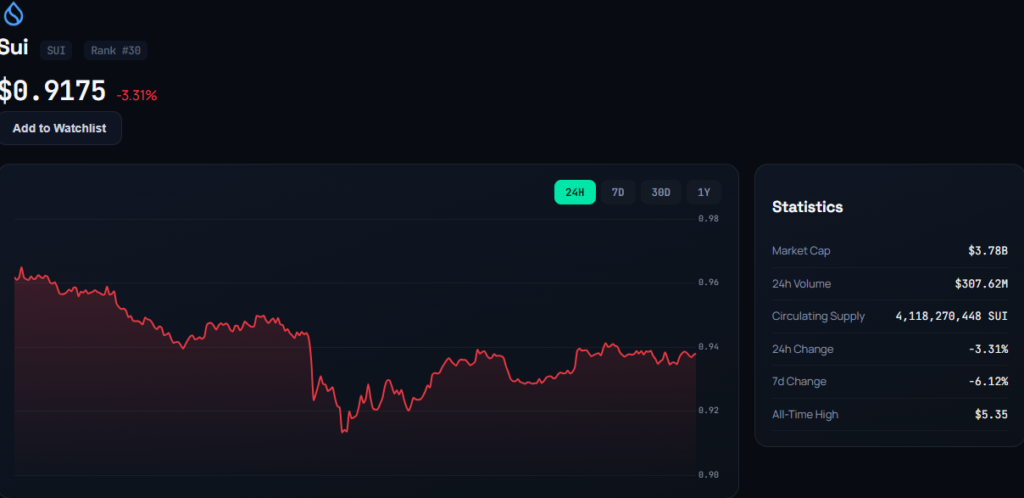
Sui price chart. Source: ChainTelegram
Bullish RSI divergence offers a reason to monitor the possibility of a rebound, but it does not outweigh the broader bearish structure on its own. Confirmation from price action, momentum, and trading activity remains necessary.
For now, the SUI price prediction remains dependent on the outcome of the current support test. Holding above $0.90 could give buyers an opportunity to challenge $1.00, while a confirmed breakdown would weaken the recovery case and leave lower support levels exposed.

Riva A. Nahar joins our team as a Crypto Journalist, covering cryptocurrency markets, blockchain developments, DeFi, and emerging trends across the digital-asset industry. With a focus on clear, accurate, and well-researched reporting, Riva brings a balanced perspective to fast-moving crypto news and market developments. Her work aims to make complex industry developments accessible while maintaining strong journalistic standards.
View all stories by Riva A. Nahar →