 BTC
 ETH
 USDT
 BNB
 USDC
 XRP
 SOL
 TRX
 FIGR_HELOC
 ZEC
 HYPE
 XMR
 DOGE
 USDS

Litecoin (LTC) Price Prediction: $48 Support in Focus as LTC Eyes a Recovery Above $50
Litecoin (LTC) is approaching an important technical area near $48 after pulling back from a sharp August rally, leaving traders watching whether the support zone can hold and allow the price to reclaim $50.


The latest price action remains part of a broader multi-year range. LTC recently moved from roughly $44 to above $55 during its August advance before retreating toward the upper-$40s. That pullback has brought the lower portion of the recent trading structure back into focus.
$48 Support Becomes the Immediate Test
The $48 area is becoming an important short-term reference point for Litecoin price analysis. A sustained hold above this region would keep the recent recovery structure intact, while a decisive move below it could expose LTC to additional downside.
The broader technical picture is not yet firmly bullish. TradingView’s latest referenced LTCUSDT readings showed a neutral overall technical summary, while the one-week and one-month ratings carried a sell bias. That combination suggests that short-term signals are mixed even as the intermediate trend remains under pressure.
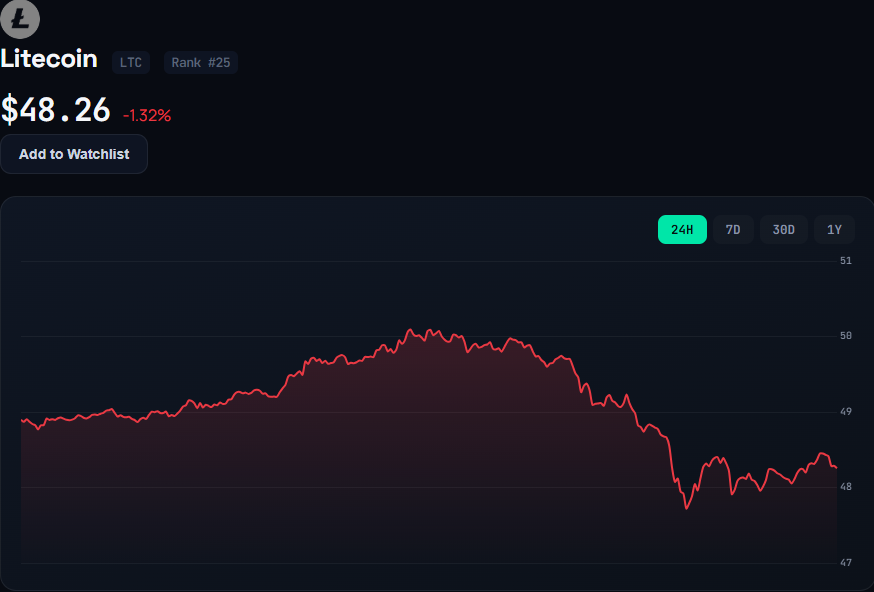
The market’s recent performance also reflects that uncertainty. In the referenced snapshot, LTC was trading near $48, down approximately 1.63% over 24 hours and about 8.10% over one week, while still showing a roughly 5.77% monthly gain.
That contrast is important. The monthly recovery has not yet translated into a sustained improvement across longer timeframes. LTC remained approximately 37% lower year to date and around 56% below its level a year earlier in the cited TradingView data.
Technical Indicators Remain Mixed
Momentum indicators do not currently provide a clear directional signal.
The referenced oscillator data showed the 14-period RSI around or below the mid-30s, placing it in neutral territory while approaching levels associated with weaker momentum. Stochastic %K was reported in the low-to-mid teens, suggesting that momentum had softened considerably. Meanwhile, CCI was around -89, and ADX was near 40, indicating that a meaningful trend may be developing, even though the aggregate oscillator reading remained neutral.
Other indicators were divided. The Awesome Oscillator and Momentum were negative, while MACD also showed a sell signal. At the same time, Stochastic RSI Fast appeared in the high teens in some readings and generated a buy signal.
The detailed oscillator breakdown therefore did not point to an established reversal. One referenced capture showed approximately two sell, seven neutral, and two buy oscillator signals.
This leaves the current LTC price prediction dependent more on confirmation than on a single momentum indicator.
Moving Averages Keep $50 in Focus
Moving averages present a more cautious picture.
The detailed technical readings showed several short-, medium-, and long-term moving averages above the current LTC price. The 10-, 20-, 30-, 50-, 100-, and 200-period averages frequently produced sell signals in the cited breakdown, with one snapshot showing about 13 sell, 1 neutral, and 1 buy across the moving-average group.
This matters because moving averages can become dynamic resistance when an asset trades below them. A recovery above the relevant averages would therefore provide stronger evidence that the recent decline is losing momentum.
The 200-period SMA, cited around the $50–$51 area in concurrent market snapshots, is particularly relevant. A sustained move through that zone could change the near-term technical picture, while repeated rejection around it would leave sellers with greater control.
Can Litecoin Reclaim $50?
For bulls, the first hurdle is relatively straightforward: LTC needs to stabilize around $48 and then recover the $50 area.
A move above $50 would place the price closer to the moving-average resistance cluster and could bring the low-to-mid-$50s back into focus. That region is significant because it overlaps with resistance identified through related pivot and Fibonacci levels.
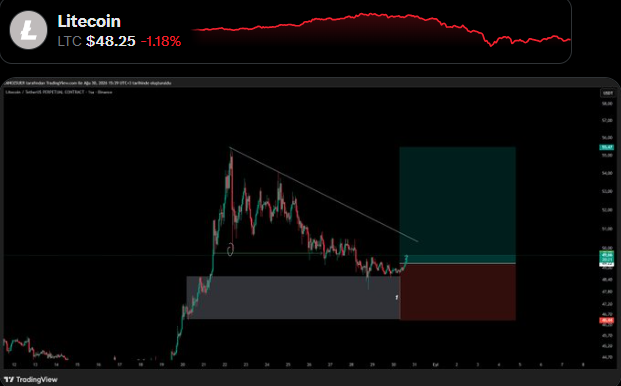
The August chart shared by trader @canozsuer also showed a sharp move from roughly $44 to above $55, followed by a correction. The chart contained a descending trendline from a peak near $55.5, highlighting the importance of the post-rally downtrend.
However, reclaiming $50 alone would not establish a new uptrend. From a technical perspective, LTC would need to maintain the recovery and eventually overcome the resistance surrounding the low-to-mid-$50s.
That distinction is important for an LTC price prediction: a short-term bounce and a confirmed trend reversal are not the same event.
Multi-Year Range Remains Important
Beyond the immediate $48-$50 area, Litecoin continues to trade within a much larger multi-year structure.
The recent move below the lower boundary of that range can be viewed as a deviation if price subsequently establishes acceptance back above the level. In technical analysis, such a move can become significant when sellers fail to maintain downside momentum and buyers push the market back into the previous range.
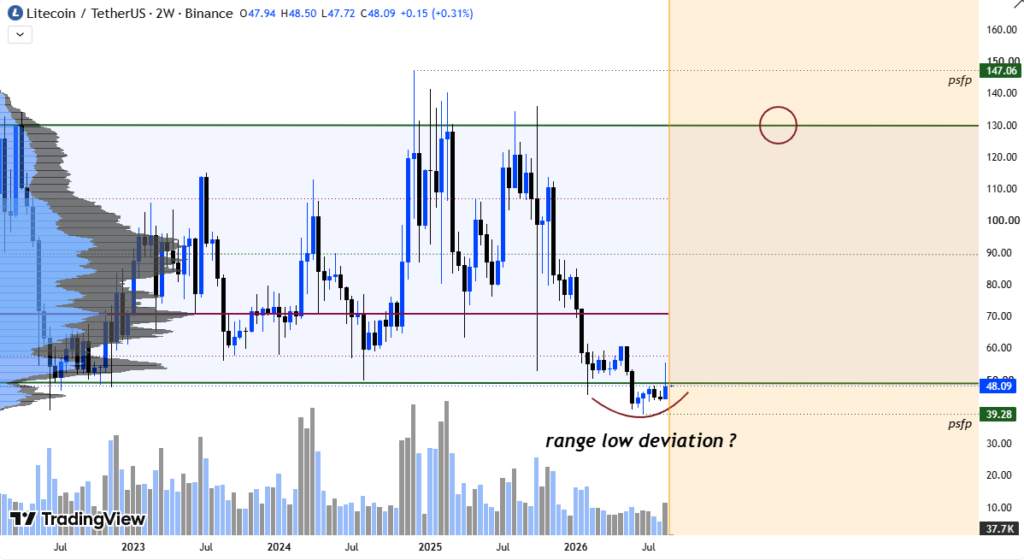
Further weekly closes above the range-low deviation would provide stronger evidence that the market is being accepted back inside the broader structure.
If that happens, the range high could eventually become the larger structural reference. However, that remains a technical scenario rather than a confirmed price target.
A return below the deviation would weaken the reclaim thesis and indicate that the market has not yet demonstrated sustained acceptance inside the range.
Litecoin Price Prediction: What Comes Next?
The immediate Litecoin price prediction remains centered on whether $48 support holds and $50 resistance can be reclaimed.
A sustained move above $50, followed by a break through the low-to-mid-$50s resistance area and the nearby 200-period moving average, would improve the technical structure. It could also bring the recent $55-plus region back into consideration.
Conversely, losing $48 would weaken the short-term recovery setup. A deeper decline toward the mid-to-high $40s would then become more relevant, particularly if LTC also fails to hold the lower boundary of its broader range.
The evidence available at the end of August therefore points to a market at a decision point rather than one with a confirmed directional breakout. TradingView’s neutral aggregate reading, sell-biased weekly and monthly signals, mixed oscillators, and sell-heavy moving-average breakdown all argue for confirmation before drawing a stronger bullish conclusion.
For now, $48 is the key support area, $50-$51 is the first major recovery hurdle, and the low-to-mid-$50s remain the next important resistance zone. How LTC behaves around these levels should provide a clearer indication of whether its August recovery can develop into a broader rebound or remains another move within its long-running range.

Riva A. Nahar joins our team as a Crypto Journalist, covering cryptocurrency markets, blockchain developments, DeFi, and emerging trends across the digital-asset industry. With a focus on clear, accurate, and well-researched reporting, Riva brings a balanced perspective to fast-moving crypto news and market developments. Her work aims to make complex industry developments accessible while maintaining strong journalistic standards.
View all stories by Riva A. Nahar →