 BTC
 ETH
 USDT
 BNB
 XRP
 USDC
 SOL
 TRX
 FIGR_HELOC
 ZEC
 HYPE
 DOGE
 XMR
 USDS

Litecoin (LTC) Price Prediction: LTC Holds $60 Support as Bulls Target $100 Breakout Above $65 Resistance
Litecoin (LTC) is trading near $61 as buyers attempt to maintain support around $60 and build momentum toward a potential recovery.


However, the Litecoin price still faces resistance between $64.50 and $65.80, a zone that could determine whether the recent rebound develops into a broader upward move. While some traders anticipate a rally toward $100 or higher, current technical signals suggest that a breakout needs confirmation.
Recent commentary from crypto traders highlights two contrasting but related bullish scenarios. One projects a longer-term move above $170 following a successful retest of a key weekly support zone, while another identifies $100 as a potential target for Litecoin over the coming months. The current price structure confirms neither projection, and both depend on LTC overcoming important resistance levels.
Litecoin Holds $60 Support as Buyers Attempt a Recovery
Litecoin has recently traded within a relatively narrow range around $60–$62, reflecting a period of consolidation after recovering from lower price levels. The $60 area remains an important near-term reference point because sustained trading above it could help buyers establish a stronger base for another advance.
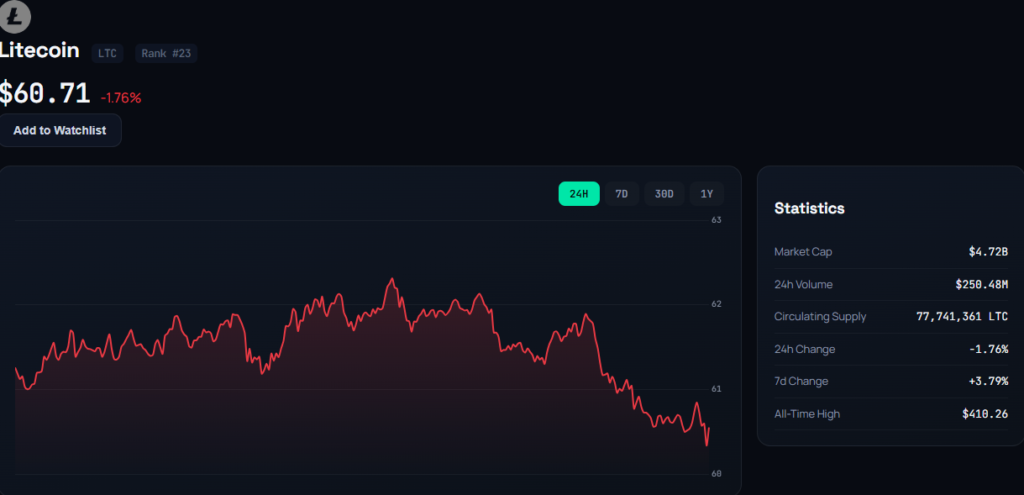
Market data referenced by TradingView placed LTC near $61.89, with a modest 24-hour gain of approximately 0.52%. The same snapshot showed a market capitalization of around $4.81 billion and a circulating supply of approximately 77.74 million LTC, against a maximum supply of 84 million coins. These figures are time-sensitive and may change as market prices and circulating supply fluctuate.
The broader performance picture remains mixed. Litecoin recorded gains over the preceding week and month in the cited data, but it remained substantially below its price levels from a year earlier. This suggests that the latest recovery represents an improvement in short-term momentum rather than conclusive evidence of a sustained long-term reversal.
For traders following the Litecoin price prediction, the immediate question is whether buyers can defend the $60–$61 support area during periods of selling pressure. A stable base could support further attempts to move higher, while a sustained breakdown would weaken the recovery setup.
$65 Resistance Remains the Key Breakout Level
The $64.50–$65.80 region is a significant technical barrier for Litecoin. The area overlaps with recent swing highs and the broader resistance zone that has limited the cryptocurrency’s recovery. LTC must reclaim this region and demonstrate sustained buying interest before a move toward $70 or higher becomes more technically credible.
A brief move above $65 would not necessarily confirm a breakout. Traders typically look for a convincing candle close above resistance, stronger trading volume, and evidence that the former resistance area is beginning to act as support. A successful retest would provide additional confirmation that buyers are gaining control.
If LTC clears this barrier, the next areas to monitor include the upper $60s and the low-to-mid $70s, where previous price reactions may attract renewed selling. A sustained move through these levels would improve the technical structure and strengthen the case for a longer recovery.
On the other hand, repeated rejection around $65 could keep Litecoin confined to its current range. In that situation, the $62–$63 area would remain an intermediate price reference, while support near $60 would continue to carry greater importance.
Crypto Traders See Potential for a Move Toward $100
Bullish projections have gained attention as Litecoin attempts to stabilize above $60. In a recent post, verified crypto trader GalaxyTrading shared a Binance Litecoin perpetual futures chart highlighting a possible upside scenario toward $100 by late 2026 or 2027.
The chart presents a potential recovery from the cryptocurrency’s recent decline, with the $100 level serving as a longer-term target rather than an immediate price objective. The projection reflects the trader’s interpretation of the chart and should not be treated as a confirmed market outcome.
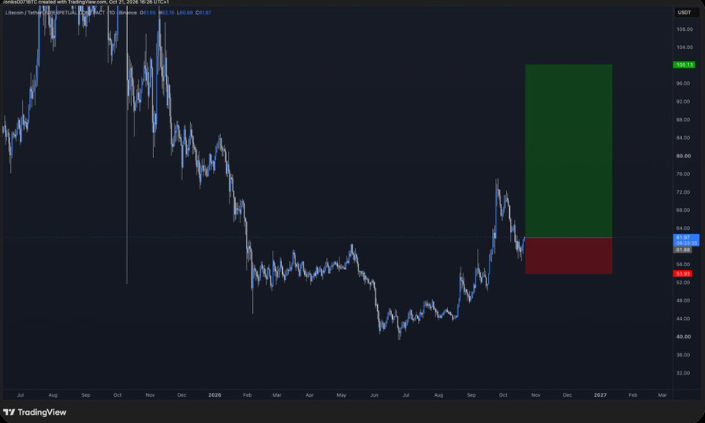
Reaching $100 from approximately $61 would require an advance of around 64%. Such a move would likely require Litecoin to overcome several intervening resistance zones and sustain demand during the recovery. Broader cryptocurrency market conditions, Bitcoin’s direction, and changes in trading volume could all influence whether that scenario develops.
The $100 level therefore remains a conditional target. A breakout above $65 would be an initial step, but LTC would still need to clear higher resistance areas before the market could establish a stronger technical basis for that projection.
Weekly Chart Highlights a Longer-Term $170 Scenario
Another bullish outlook comes from verified crypto trader Rod, who posted on October 21 that Litecoin’s weekly chart was showing a potentially favorable setup. Referring to the chart structure, Rod wrote, “The $LTC setup is getting stupidly clean,” pointing to a weekly reversal order block and a possible continuation toward $170 or higher if the support zone holds.
The analysis identifies the $45–$50 region as an important historical demand area. An order block is a charting concept used by some traders to identify price zones associated with significant previous buying or selling activity. In this case, the trader’s thesis is that a successful retest of the zone could provide a foundation for a larger upward move.
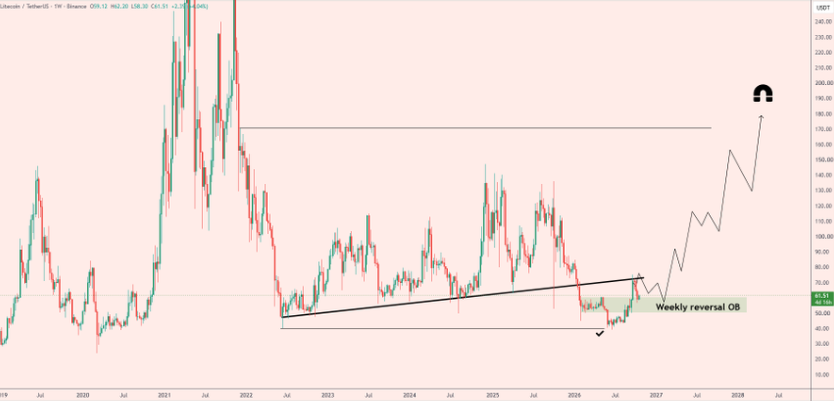
However, Litecoin is currently trading above that highlighted area. The projected path toward $170 therefore represents a longer-term scenario rather than evidence that such a rally is already underway. Price would need to establish a sequence of higher highs and higher lows and overcome several resistance levels along the way.
The distinction between the two bullish forecasts matters. GalaxyTrading’s chart focuses on a potential move toward $100, while Rod’s analysis presents a more ambitious target above $170. Both are individual technical interpretations, not independently verified price forecasts.
Litecoin Technical Indicators Present a Mixed Picture
TradingView’s aggregated technical assessment provides a more cautious counterpoint to the bullish projections. The cited overview described Litecoin’s overall technical rating as neutral, with a more constructive reading on the weekly timeframe but a weaker assessment on the monthly timeframe.
This divergence suggests that shorter-term recovery signals have not yet resolved the broader trend. Moving averages can help identify the direction of recent price action, while oscillators such as the Relative Strength Index (RSI) measure momentum. Neither indicator can reliably predict future prices on its own.
Other cited market data placed LTC below its 20-period simple moving average near $64, while trading around the 50-period average near $60.60. Longer-period averages were reported in the low-to-mid $50s. These readings point to an asset attempting to recover while still facing resistance from shorter-term price trends.
The RSI was also reported in the mid-40s to high-40s, a range generally associated with neither overbought nor oversold conditions. This leaves room for momentum to improve, but it does not independently establish a bullish reversal.
Because technical indicators change with market prices and chart timeframes, traders should verify current readings before concluding. Trading volume and the behavior of LTC around established support and resistance zones remain important considerations.
Litecoin Price Prediction: What Comes Next for LTC?
The near-term Litecoin price prediction depends largely on whether LTC can defend the $60 support area and establish a sustained move above $65. A confirmed breakout could open the way toward the upper $60s and the $70–$75 region, strengthening the technical case for a broader recovery. Reaching $100, however, would require additional gains and a series of successful moves through resistance.
If buyers fail to overcome $65, Litecoin could remain range-bound or revisit support near $60. A decisive move below that area would bring the $58–$59 zone into focus, with the $55–$57 region representing a deeper downside reference.
For now, Litecoin’s chart presents a potential recovery opportunity alongside unresolved downside risks. The $100 and $170 forecasts offer possible longer-term scenarios, but neither is supported by a confirmed breakout at present. Price action around $60 and $65 should provide a clearer indication of whether the current consolidation is developing into a stronger recovery or remains part of a wider corrective trend.

Riva A. Nahar joins our team as a Crypto Journalist, covering cryptocurrency markets, blockchain developments, DeFi, and emerging trends across the digital-asset industry. With a focus on clear, accurate, and well-researched reporting, Riva brings a balanced perspective to fast-moving crypto news and market developments. Her work aims to make complex industry developments accessible while maintaining strong journalistic standards.
View all stories by Riva A. Nahar →