 BTC
 ETH
 USDT
 BNB
 USDC
 XRP
 SOL
 TRX
 FIGR_HELOC
 ZEC
 HYPE
 XMR
 DOGE
 USDS

Litecoin (LTC) Price Today: LTC Bearish Trend Persists Near $51 as Bullish RSI Divergence Signals Potential Rebound
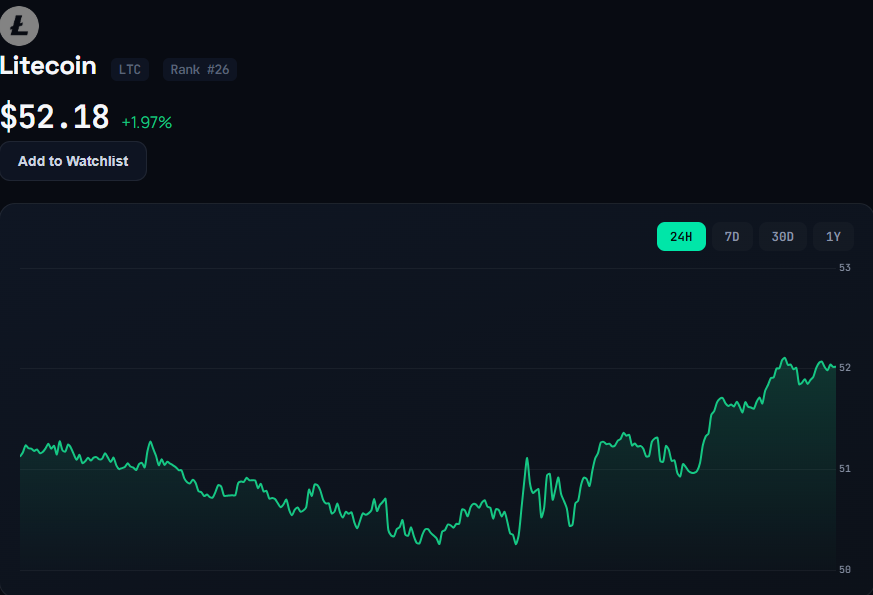
Litecoin (LTC) is holding near the $51 area after a recent decline, with its broader bearish structure still intact even as bullish RSI divergence points to a possible short-term recovery.


LTC was trading around $51.6–$52.1 on September 17, according to current market data. Recent daily prices show that the cryptocurrency fell from the mid-$50s earlier in September before stabilizing near the low-$50 region.
The conflicting signals leave Litecoin at an important technical juncture. Price structure still reflects selling pressure, while momentum indicators on shorter timeframes have started to improve.
Litecoin Price Faces Resistance After Rejection
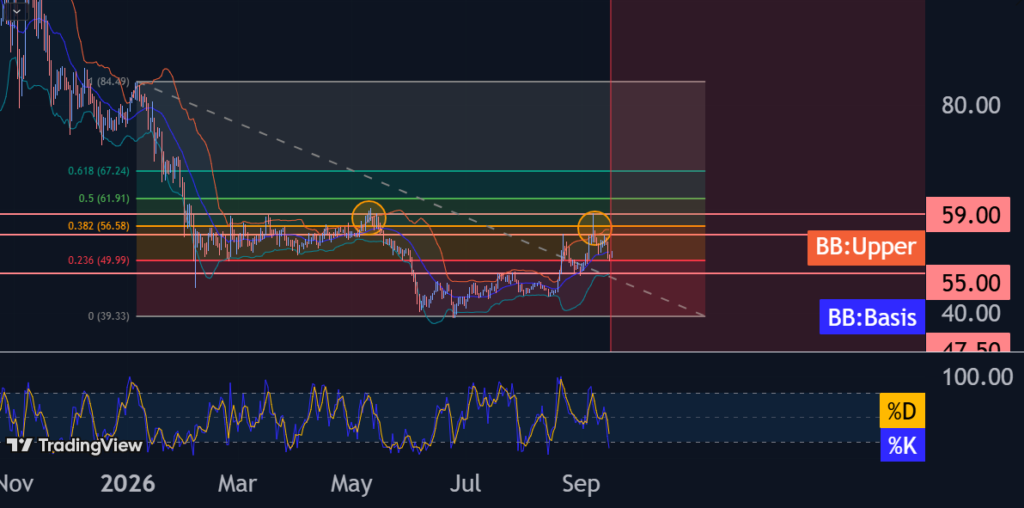
The recent decline followed a rejection from the $55–$59 region, which the supplied technical analysis identified as a significant resistance zone. Litecoin reached an intraday high of $55.23 on September 13 before moving lower over the following sessions.
The rejection also coincided with the upper portion of the daily Bollinger Band and the 38.2% Fibonacci retracement of the broader decline from January, according to the technical setup.
A daily Shooting Star formation was identified around this resistance area. In technical analysis, such a candlestick can indicate that buyers attempted to push prices higher but sellers regained control before the session closed.
The subsequent move toward $51 strengthened the bearish interpretation. However, the current price action has not yet produced a confirmed breakdown of the broader support structure.
Bullish RSI Divergence Points to Potential Rebound
While the higher-timeframe trend remains weak, the shorter-term chart has produced a different signal.
The supplied one-hour analysis identified bullish RSI divergence after Litecoin established another lower low. During the same move, the Relative Strength Index formed a higher low. This creates a divergence because price and momentum are moving in opposite directions.
Such a setup can indicate that downward momentum is losing strength. It does not, however, establish that a sustained trend reversal has begun.
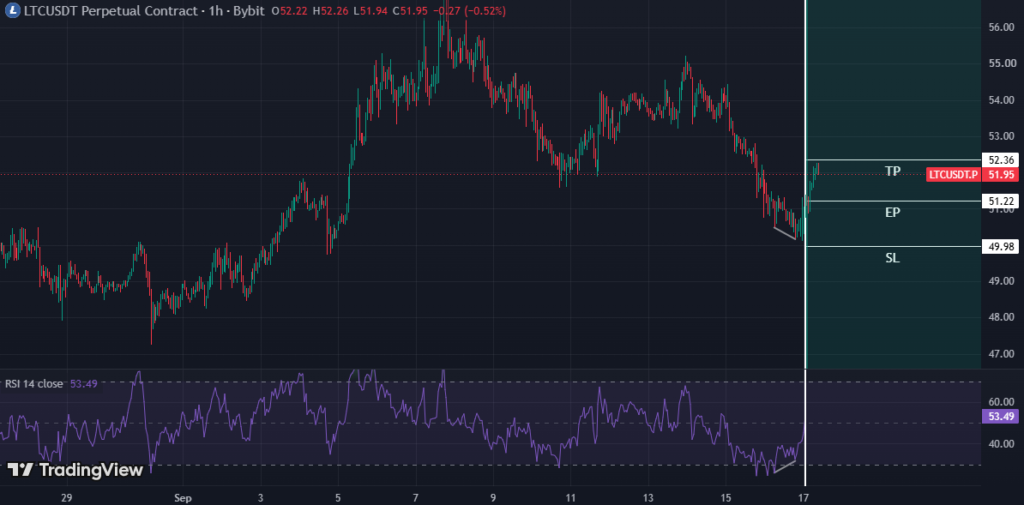
The referenced trade setup used $51.22 as an entry, with $52.36 as the upside target and $49.98 as the invalidation level. These levels describe a specific countertrend setup rather than a confirmed market reversal.
That distinction is important. For Litecoin to transition from a short-term rebound into a broader recovery, traders would generally look for higher highs and higher lows to replace the existing bearish sequence.
LTC Price Analysis Shows Mixed Momentum Signals
Current technical readings underline the difference between short-term momentum and the larger trend.
Investing.com’s September 17 technical snapshot showed an RSI(14) around 57, while the 5-, 10-, 20-, and 50-period moving averages were positioned around the $51–$52 area. At the same time, the 100- and 200-period averages remained higher, around $52.3–$53.1, depending on the calculation method.
These figures suggest that Litecoin has recovered above several shorter-term averages but remains below important longer-term averages.
The same technical data also showed elevated readings in some momentum indicators. For example, Stochastic RSI was near 100 in one snapshot, while Williams %R and other oscillators were approaching overbought territory.
This creates a more nuanced picture than a simple bullish or bearish reading. Short-term momentum has improved, but some indicators suggest that the recovery could encounter resistance if buying pressure fails to expand.
The TradingView data supplied for this analysis, meanwhile, showed a broader sell bias across its daily, weekly, and monthly technical summaries, with moving averages carrying a stronger sell signal than the oscillator group.
$47.50 Support Remains an Important Level
The $47.50 area is another key reference point in the current Litecoin price analysis.
The supplied daily-chart analysis identified $47.50 as the next major support after the rejection from $55–$59. A sustained move toward that level would indicate that sellers remain capable of extending the decline.
Conversely, holding above the low-$50 region would give the short-term bullish divergence more room to develop.
The distinction between support holding and a genuine trend reversal is important. A bounce from support alone would represent a recovery within the existing structure. A more meaningful change would require Litecoin to reclaim resistance and establish a sequence of higher highs and higher lows.
What the LTC Price Prediction Depends On Next
For the near term, the $50–$52 area is likely to remain important because Litecoin is trading close to several short- and medium-term moving averages.
A move above the $52–$53 region would put the longer-term moving averages back into focus. Current technical data places the 100- and 200-period averages roughly between $52.3 and $53.1.
Beyond that, the previously rejected $55–$59 zone remains a major technical reference. Reclaiming that area would materially change the immediate price structure, although it would still need confirmation through subsequent price action.
On the downside, failure to maintain the low-$50 region could expose Litecoin to renewed selling pressure, with $47.50 emerging as a key level from the supplied chart analysis.
Therefore, the present LTC price prediction is better viewed as a range of technical scenarios rather than a fixed price target: a sustained recovery would require improving market structure, while a break below key support would reinforce the existing bearish trend.
Litecoin’s Broader Market Position
Litecoin remains substantially below its historical peak. CoinMarketCap currently lists LTC’s all-time high at approximately $412.96, recorded in May 2021, leaving the cryptocurrency more than 87% below that level at current prices.
Its capped supply is 84 million LTC, while roughly 77.6 million coins are currently in circulation, according to current market data.
The network’s monetary supply also changes through periodic halving events, with the block reward reduced every 840,000 blocks. The most recent halving occurred in 2023, reducing the mining reward from 12.5 LTC to 6.25 LTC per block.
These longer-term characteristics are relevant to Litecoin’s market structure, but they do not determine short-term price movements. Near-term LTC price action remains heavily influenced by technical positioning and broader cryptocurrency-market conditions.
Litecoin ETF Adds Another Market Variable
Institutional access is another factor investors may monitor when assessing Litecoin’s broader market environment.
Canary Capital’s Litecoin ETF, listed under the ticker LTCC, provides exposure to Litecoin through a trust structure that holds LTC. The issuer describes the product as a passive vehicle designed to track the price of Litecoin, less expenses and liabilities.
However, the existence of an ETF does not establish a particular direction for LTC’s price. Its relevance depends on factors such as demand, market liquidity, broader digital-asset sentiment, and the relationship between ETF activity and the underlying spot market.
For the immediate technical setup, those factors remain secondary to whether Litecoin can hold its current support and recover the resistance levels above $52.
Litecoin Price Prediction: Key Levels to Watch
The current chart presents several levels that can help define the next stage of Litecoin’s price action:
- $49.98: The invalidation level used in the supplied short-term bullish-divergence setup.
- $50–$52: The current trading and consolidation area around which short-term momentum is developing.
- $52–$53: An important zone containing several longer-period moving averages.
- $55–$59: The previously rejected resistance area and a major test for any broader recovery.
- $47.50: The next downside support highlighted in the supplied daily analysis.
At around $51–$52, Litecoin therefore sits between conflicting technical signals. The broader structure remains bearish, while bullish RSI divergence suggests that selling momentum may be weakening on the shorter timeframe.
For now, the divergence is a potential rebound signal rather than confirmation of a trend change. A sustained recovery would require Litecoin to reclaim successive resistance levels and establish a stronger bullish market structure. A failure to hold current support, particularly if followed by a move toward $47.50, would keep the broader bearish scenario in focus.
Technical indicators can change quickly, and they represent only one part of Litecoin price analysis. Broader crypto-market conditions, liquidity, macroeconomic developments, and fundamental factors can also materially affect LTC’s price.

Riva A. Nahar joins our team as a Crypto Journalist, covering cryptocurrency markets, blockchain developments, DeFi, and emerging trends across the digital-asset industry. With a focus on clear, accurate, and well-researched reporting, Riva brings a balanced perspective to fast-moving crypto news and market developments. Her work aims to make complex industry developments accessible while maintaining strong journalistic standards.
View all stories by Riva A. Nahar →