 BTC
BTC  ETH
ETH  USDT
USDT  BNB
BNB  XRP
XRP  USDC
USDC  SOL
SOL  TRX
TRX  ZEC
ZEC  FIGR_HELOC
  HYPE
HYPE  DOGE
DOGE  XMR
XMR  WBT
WBT 
Litecoin (LTC) Price Prediction: $54 Resistance, $47.69 Support Set LTC’s Path Toward $60
Litecoin is consolidating after a sharp recovery, with the $54 resistance area and $47.69 support zone emerging as important levels for determining whether LTC can attempt another move toward $60.


The latest Litecoin price action shows a market caught between short-term recovery momentum and broader technical pressure. LTC recently climbed toward the upper-$50s before facing rejection, while the subsequent pullback has brought attention back to established support levels.
LTC Price Faces Resistance Near $54
LTCUSDT is trading around the $52.8–$53.5 area in mid-September, according to the latest technical snapshots. The price has struggled to establish a sustained move above $54 after recovering from lower levels.
One recent technical setup identified a spike toward $59 as a liquidity grab, followed by rejection and a series of lower highs below $54. In that structure, the $54 area has become an important short-term barrier.
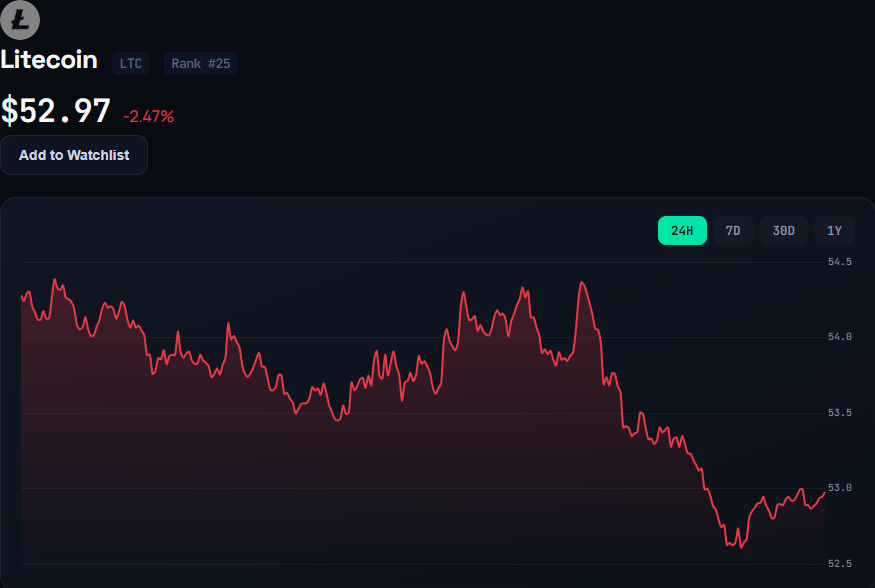
A sustained move above $54 would not automatically confirm a larger rally, but it would improve the immediate technical structure. The next resistance areas are around $55.13 and the recent swing zone near $56, with $60.11 representing the larger upside target highlighted by the bullish setup.
$47.69 Support Remains Critical
The $47.69 level has gained importance because it coincides with the rising trendline of the ascending structure identified in recent chart analysis.
One technical report described LTC as having developed a bullish structure after finding support near $47.70. The subsequent breakout toward $54 was followed by a correction, bringing the $47.69 region back into focus.

If buyers continue to defend this area, the broader ascending structure will remain intact. A decisive breakdown, however, would weaken that setup and could expose LTC to lower support zones around $50 and potentially $48.
This makes $47.69 more than a single price target. It functions as an important technical invalidation area for the current bullish structure.
Technical Indicators Show a Mixed Picture
The broader Litecoin price analysis remains divided across timeframes.
TradingView’s technical framework has recently shown a stronger short-term bias, with daily readings leaning toward buy or strong buy in some snapshots. The one-week assessment has been closer to neutral, while the one-month view has remained sell-leaning.
Momentum indicators also vary between snapshots. Some daily RSI readings have appeared in the high-30s to low-40s, indicating relatively weak momentum and proximity to oversold conditions. Other readings have been closer to 55–61, suggesting a more neutral momentum environment.
MACD readings have often stayed near zero or in negative territory, while stochastic and Williams %R readings have often pointed to selling pressure or oversold conditions. ADX readings ranging from the mid-20s into the 40s suggest that a meaningful trend has been present during several recent sessions.
Moving averages provide another source of caution. LTC has frequently traded below short-term 5-, 10-, 20-, and 50-period averages clustered around $53–$54. Longer-term averages have occasionally produced more constructive signals, creating a divergence between short-term weakness and the broader technical structure.
Could Litecoin Move Toward $60?
A move toward $60 remains technically possible, but it depends on several levels being reclaimed rather than simply on the recent recovery.
The first hurdle is $54. A break and sustained hold above that zone could bring $55.13 into focus. Above that, resistance around $56 could become the next test before LTC approaches the $59–$60 region.
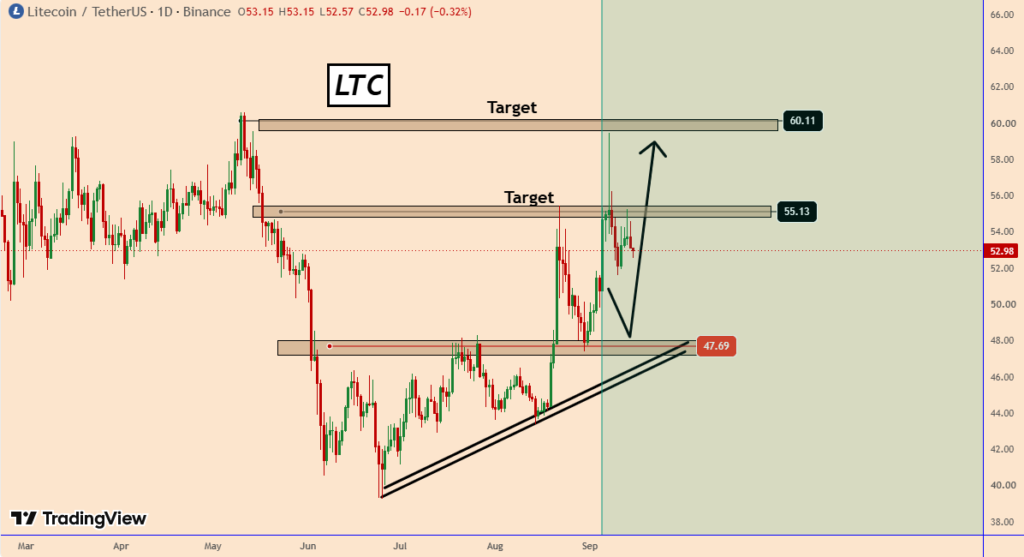
The $60.11 target comes from the previously identified ascending setup rather than from a confirmed breakout. Therefore, it should be viewed as a potential technical objective rather than a forecast with certainty.
Volume will also be important. A move above resistance accompanied by stronger trading activity would provide more convincing evidence of a breakout than a low-volume price move.
What Happens if $47.69 Breaks?
The bullish structure would face a significant technical setback if LTC loses $47.69 together with the rising trendline.
In that scenario, the market could first revisit the $50–$51 area before testing lower demand around $48. The earlier liquidity-grab analysis also identified the $48 region as a potential area of interest following a breakdown.
Below these levels, the broader support structure extends toward the $49–$50 zone and, at deeper levels, the $39–$40 area that has marked important lows within the wider 52-week range.
A breakdown would therefore shift the focus away from the $55–$60 upside scenario and toward determining whether LTC can establish a new base at lower support.
Litecoin’s Broader Market Structure
Despite the recent monthly recovery, Litecoin remains well below its previous cycle highs. The latest 52-week range has extended from roughly $39 to $136, highlighting the substantial volatility surrounding the asset.
The current setup is consequently better described as a consolidation and recovery phase than as confirmation of a new long-term uptrend.
Litecoin’s network fundamentals also remain relevant to its longer-term valuation. The cryptocurrency has a fixed maximum supply of 84 million LTC, while its most recent halving occurred in August 2023, reducing the mining reward from 12.5 LTC to 6.25 LTC per block.
These structural characteristics can provide context for long-term Litecoin projections, but they do not determine short-term price movements. Market liquidity, Bitcoin’s direction, broader crypto sentiment, and technical positioning can have a much more immediate effect on LTC.
Litecoin Price Prediction: Key Levels to Watch
For the current setup, several price zones stand out:
- $47.69: Key structural support and rising trendline area.
- $50–$51: Near-term support zone if the current pullback extends.
- $54: Immediate resistance and an important level for recovering upside momentum.
- $55.13: First major bullish reclaim level from the recent setup.
- $56: Additional resistance near the recent swing area.
- $59–$60.11: Larger resistance and potential upside objective.
The technical picture therefore remains balanced between a recovery scenario and renewed downside pressure. Holding $47.69 would preserve the ascending structure, while reclaiming $54 and subsequently $55.13 would strengthen the case for a retest of the $59–$60 region.
Conversely, a decisive loss of $47.69 would weaken the bullish setup and make lower support levels more relevant. For now, the most important development is whether Litecoin can turn the $54 resistance area into support while maintaining the broader structure above $47.69.
This Litecoin price prediction is based on technical levels and market data available at the time of writing. Cryptocurrency markets can change rapidly, and the scenarios discussed above should not be interpreted as guaranteed outcomes or investment advice.

Riva A. Nahar joins our team as a Crypto Journalist, covering cryptocurrency markets, blockchain developments, DeFi, and emerging trends across the digital-asset industry. With a focus on clear, accurate, and well-researched reporting, Riva brings a balanced perspective to fast-moving crypto news and market developments. Her work aims to make complex industry developments accessible while maintaining strong journalistic standards.
View all stories by Riva A. Nahar →