 BTC
 ETH
 USDT
 BNB
 XRP
 USDC
 SOL
 TRX
 FIGR_HELOC
 ZEC
 HYPE
 XMR
 DOGE
 USDS

XRP Price Today: $1.30 Support Breakdown Points to $1 Retest
XRP is facing renewed downside risks after losing the $1.30 support level in late October, although its November 5 recovery has brought the token back above that threshold.


The latest price action leaves traders watching whether buyers can defend the reclaimed level or whether another rejection could expose lower support zones.
The XRP price traded around $1.31 on November 5, gaining approximately 2.6% over 24 hours. However, the recovery remains fragile after an October decline of more than 14%, with the broader daily trend still showing pressure from overhead moving averages.
XRP Price Analysis: What Happened to the $1.30 Support?
The breakdown followed a period of consolidation around $1.30 throughout October. Buyers defended the level on October 14, 16, 21, 24, and 27, preventing XRP from extending its decline. However, selling pressure intensified on October 29 and 30, pushing the token from approximately $1.32 to an intraday low near $1.21 in less than 36 hours.
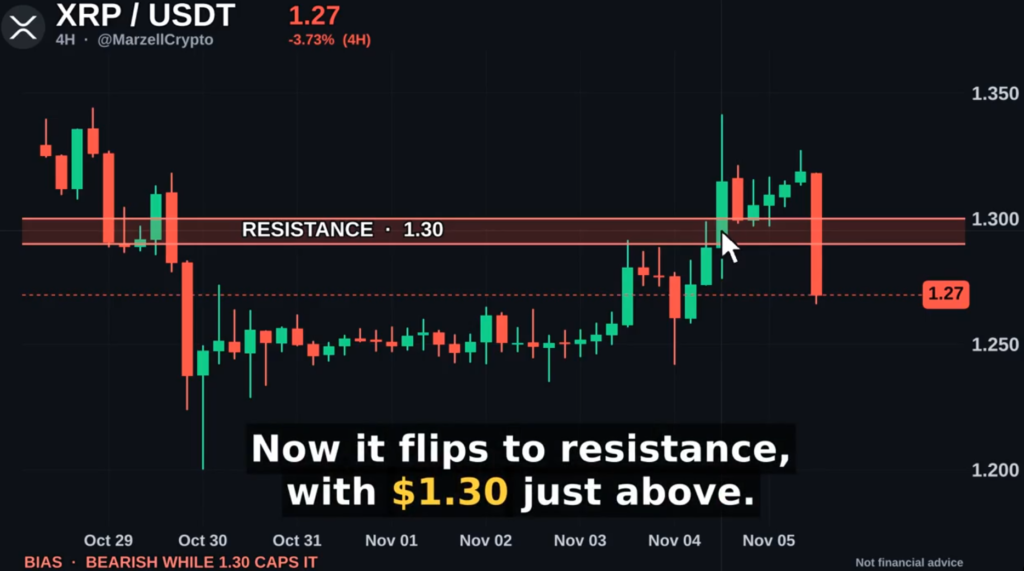
Two consecutive daily candles closed below $1.30, weakening the previous support structure. The October 30 decline also tested the $1.20 region, where buyers eventually entered and triggered a recovery. This level now represents an important reference point for assessing whether the recent rebound can hold.
The technical picture has improved since the breakdown, but a complete trend reversal remains unconfirmed. On November 5, XRP traded above its daily 20-period exponential moving average (EMA) near $1.30. However, the 50-day EMA around $1.34 and the 200-day EMA near $1.35 continue to create overhead resistance.
The daily Relative Strength Index (RSI) stood near 47.9, below the neutral 50 threshold. This indicates that buying momentum has improved but has yet to establish a convincing bullish trend. A daily close above $1.34 would provide stronger evidence of recovery, while another move below $1.30 could weaken the recent price structure.
XRP Price Prediction: Can XRP Retest $1?
The $1.20 support zone is the first important level to monitor if sellers regain control. This area previously attracted buyers during the October 30 decline and coincides with the median region of XRP’s descending price channel.
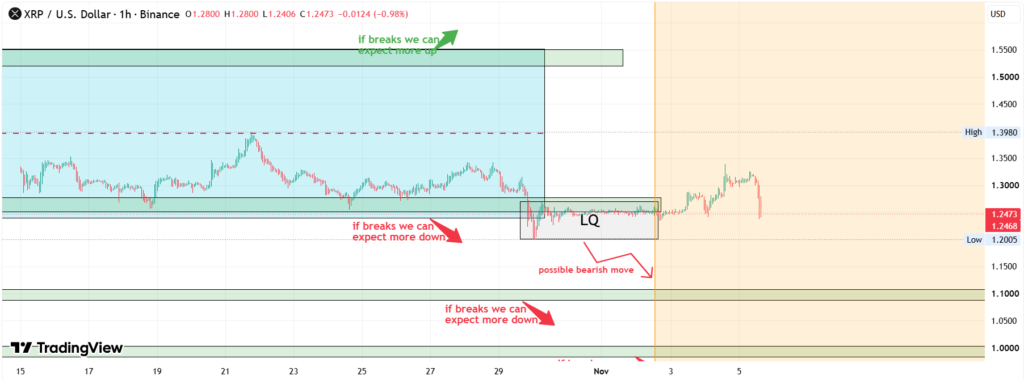
A sustained move below $1.20 could expose the lower channel boundary around $1.10. Further selling pressure could then bring the psychological $1.00 threshold into focus. This level also corresponds with the August lows, making it a relevant reference point for longer-term technical analysis.
However, a move toward $1 is not yet a confirmed outcome. XRP would first need to lose the $1.30 area again and break below $1.20 to strengthen the bearish scenario. Without those developments, the $1.00 level remains a deeper downside possibility rather than an immediate target.
On the upside, holding above $1.30 could allow XRP to consolidate before another attempt at $1.34–$1.35. A sustained move through this resistance cluster would improve the daily technical outlook and potentially open the way toward $1.40.
Crypto analyst Xaif Crypto described an earlier improvement in buying activity as a “short-term bullish shift, but not confirmed.” The analyst pointed to a positive turn in cumulative volume delta (CVD), which measures the difference between aggressive buying and selling activity. However, sustained demand would still be necessary to confirm a broader reversal.
XRP ETF Demand Provides a Mixed Signal
Institutional investment activity presents another factor in the current XRP price outlook. US spot XRP ETFs recorded approximately $18.83 million in net inflows during October, marking their seventh consecutive month of positive flows.
However, October’s figure was the smallest monthly inflow since the positive streak began in April. It also represented a significant decline from September’s $121.40 million and August’s $159.18 million. Cumulative net inflows reached approximately $1.81 billion, while total ETF net assets declined from $1.68 billion to $1.42 billion during October.
These figures suggest that institutional demand has remained positive, but its pace has weakened. More importantly, ETF inflows did not prevent XRP from losing 16% of its value during October.
This divergence highlights the difference between institutional investment flows and immediate spot-market demand. Continued ETF accumulation could help support sentiment, although it does not guarantee that buyers will defend the $1.20 or $1.30 technical levels.
What Comes Next for XRP?
XRP’s November 5 recovery has brought the $1.30 level back into focus, leaving the cryptocurrency at an important technical juncture. The immediate question is whether buyers can maintain this position and overcome the resistance cluster between $1.34 and $1.35.
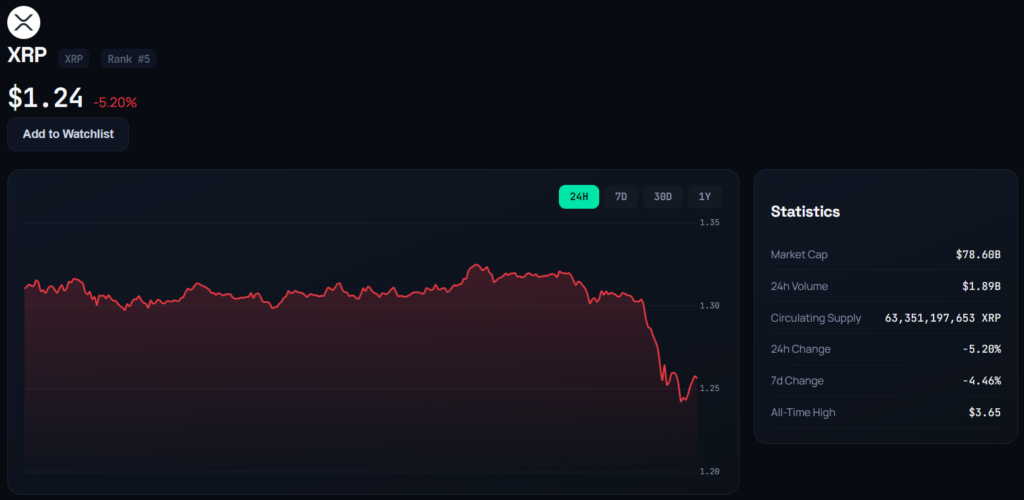
A sustained daily close above $1.35 would strengthen the recovery case, while a rejection followed by a close below $1.30 would increase the risk of another test of $1.20. A decisive breakdown of that support could expose $1.10 and eventually the $1.00 psychological level.
For now, the XRP price prediction remains dependent on how the market responds to these closely positioned support and resistance levels. The recent rebound has reduced immediate downside pressure, but the broader daily structure still requires further confirmation before a lasting bullish reversal can be established.

Jack Spencer is a financial journalist and crypto market analyst covering digital assets, blockchain innovation, and global market developments. His reporting focuses on cryptocurrency price trends, regulation, institutional adoption, and the evolving digital asset ecosystem.
View all stories by Jack Spancer →