 BTC
 ETH
 USDT
 BNB
 XRP
 USDC
 SOL
 TRX
 FIGR_HELOC
 ZEC
 HYPE
 DOGE
 XMR
 USDS

SUI Price Today: $1.10–$1.15 Resistance Caps SUI Recovery Despite $14M Inflows
Sui (SUI) faces a critical technical test, as reported investment-product inflows of about 14 million tokens over five consecutive weeks clash with a developing bearish chart structure.


With the price trading near $1.05, traders are watching the $1.00 support level and the $1.10–$1.15 resistance zone for signs of the next directional move.
The contrasting signals come as the Sui ecosystem announces developments involving stablecoin payments, Bitcoin-backed financial products, and high-throughput transaction infrastructure. However, these advances have not yet produced a decisive bullish reversal on the price chart, leaving the short-term outlook dependent on whether buyers can defend support and overcome nearby resistance.
SUI Investment Products Record Five Consecutive Weeks of Inflows
According to the reported Glassnode data, investment products linked to SUI recorded approximately 14 million tokens in cumulative net inflows across five consecutive weeks, covering the period from September 14 to October 5. The sustained positive readings suggest continued demand for exposure to the asset through these products.
However, the product classification requires care. The available information does not establish that the figures represent U.S.-listed spot exchange-traded funds (ETFs). Exchange-traded products (ETPs) and other investment vehicles may have different structures and regulatory status, so the figures should not automatically be described as U.S. spot ETF inflows.
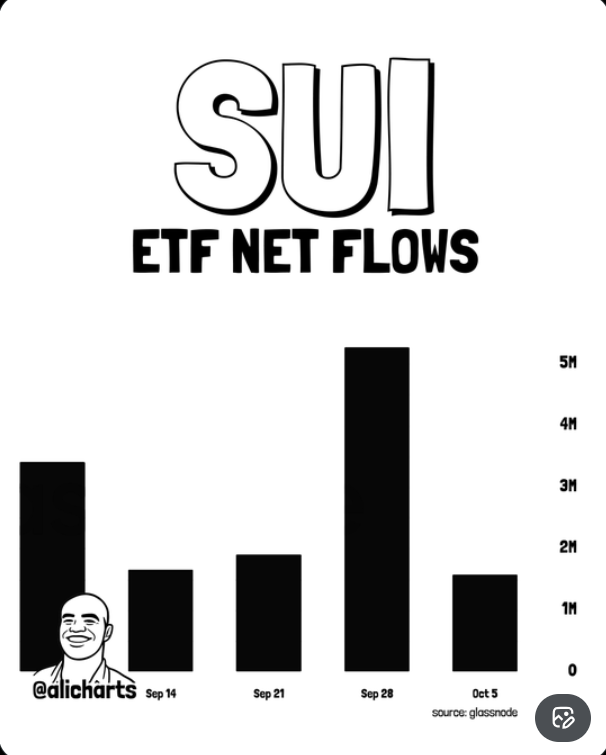
The reported accumulation also coincides with several developments across the Sui ecosystem. These include a planned USDC integration with Samsung Wallet, the upcoming launch of the Hashi Bitcoin-finance protocol, and advances in infrastructure designed to support AI agent transactions.
Although the timing may help explain renewed investor interest, it does not prove that these announcements caused the inflows or that investment-product demand will translate directly into sustained spot-market buying.
Sui Ecosystem Developments Add to the Fundamental Picture
Recent announcements have expanded Sui’s presence across payments, decentralized finance (DeFi), and blockchain infrastructure.
On October 8, the Sui Foundation announced that Samsung Wallet would integrate USDC transfers on Sui for eligible users across approximately 82 million U.S. Galaxy devices. The initial rollout is planned for the United States, with expansion to other markets intended later.
The integration could make stablecoin transfers more accessible through an established consumer wallet. However, the launch announcement specifies that USDC is the supported asset at launch, not the SUI token itself. Consequently, wider access to USDC on Sui does not automatically create equivalent demand for SUI.
Another development involves Hashi, a Bitcoin finance protocol preparing for a phased mainnet rollout. The Sui Foundation reported more than $500 million in committed capital from its launch coalition, with applications intended to support Bitcoin-backed lending, borrowing, and other financial activities.
If implemented successfully, these services could expand the range of financial applications operating within the Sui ecosystem. Nevertheless, committed capital is not the same as capital already deployed, and the announcement alone does not establish how much activity or token demand the protocol will generate.
SUI Price Prediction: $1.00 Support Faces a Key Test
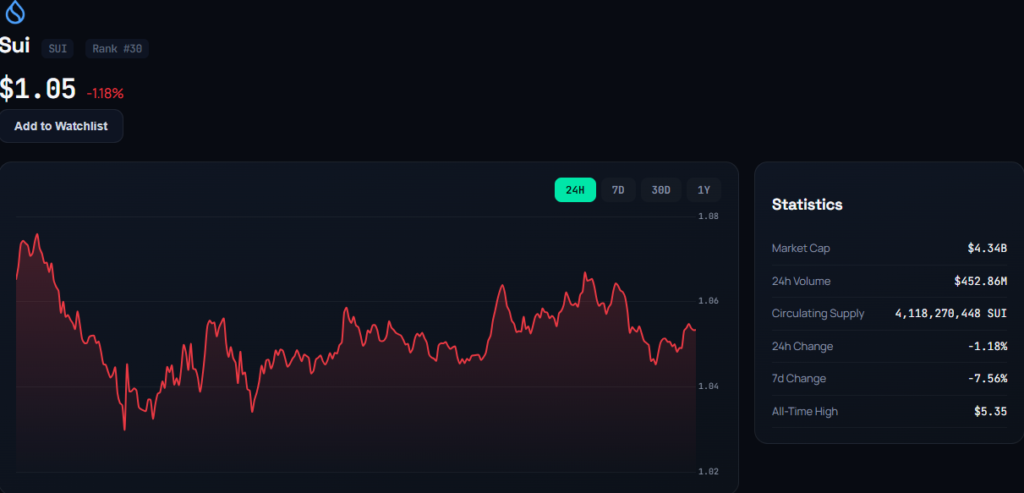
SUI was trading near $1.05 in the supplied market snapshot, placing it close to the psychological $1.00 threshold. Recent price action has also identified the broader $0.99–$1.03 region as an important area to monitor.
The immediate question is whether buyers can maintain demand around this zone after the recent pullback. A sustained hold above $1.00 could allow the market to consolidate and attempt another move toward overhead resistance. However, a brief move below the level would not, by itself, establish a breakdown; the duration of the move and subsequent price action would also matter.
Technical indicators provide a mixed picture. The supplied TradingView technical overview showed a broadly neutral daily reading, while the monthly assessment leaned toward sell. Relative Strength Index (RSI) readings around the mid-50s in one daily snapshot did not indicate an extreme overbought or oversold condition.
$1.10–$1.15 Resistance Could Determine the Recovery Attempt
Above the current price, the $1.10–$1.15 region represents the first major resistance zone identified in the supplied technical analysis. A higher resistance area sits around $1.20–$1.25, where previous advances encountered selling pressure.
A move above $1.10 would be an initial sign of improving short-term momentum, but a more convincing recovery would require SUI to reclaim the broader resistance zone and hold above it. Without that confirmation, an advance could remain a temporary rebound within a weaker structure.
The distinction matters because SUI has shown substantial gains over the monthly period in the supplied market data despite a recent weekly decline. Such divergent timeframes can make the chart appear constructive over one period while remaining vulnerable over another.
Bearish Chart Structure Raises the Risk of a Deeper Correction
A separate technical assessment suggests that SUI may be developing a corrective pattern following its earlier advance. The analyst describes the structure as a possible triangle or a more complex correction, with a marked flip zone that could influence the next phase of price action.
Under this interpretation, the completion of a potential Wave D could precede a Wave E move within the proposed bearish structure. However, Elliott Wave labels are interpretive, and the available information does not establish that the pattern is complete or that another downward leg has begun.
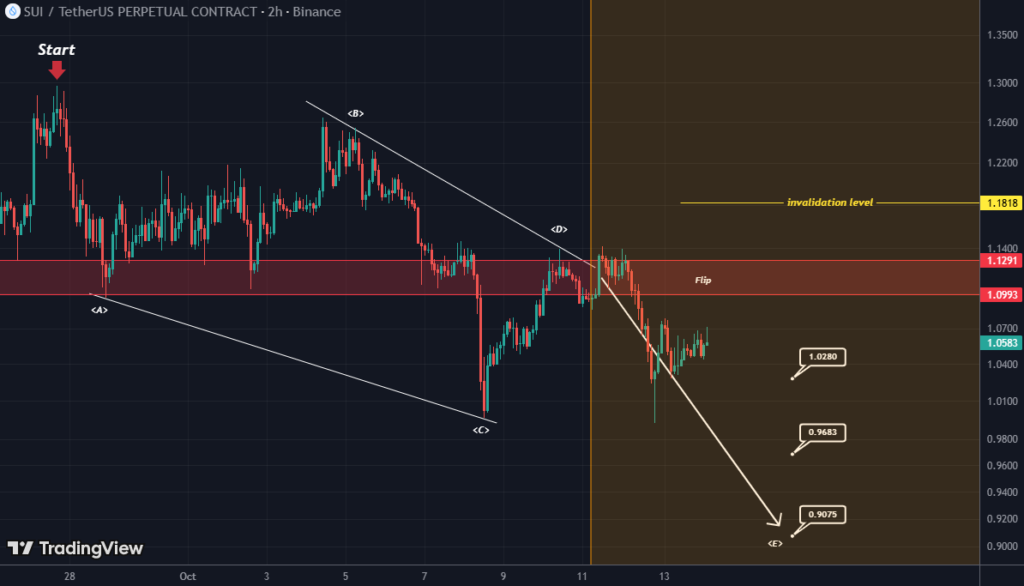
The bearish case would gain support if SUI loses the $1.00 area and fails to recover it. A sustained breakdown could expose lower demand zones, although the supplied material does not provide sufficiently clear numerical downside targets to establish reliable price objectives.
SUI Price Outlook: Investment Inflows Meet Technical Uncertainty
The current SUI price outlook reflects a clear divide between improving ecosystem developments and unresolved technical risks. Reported investment-product inflows of approximately 14 million SUI over five weeks suggest continued interest, while the Samsung Wallet integration, Hashi’s planned launch, and the throughput demonstration provide additional context for the network’s development.
Yet none of these developments guarantees near-term price appreciation. Investment-product flows can change, announced integrations may take time to generate measurable usage, and technical patterns can fail to develop as expected.
The immediate levels remain straightforward: $1.00 is the key support area, while $1.10–$1.15 is the first resistance zone. Holding support and reclaiming resistance would improve the short-term technical picture. A confirmed breakdown below $1.00, particularly if followed by unsuccessful recovery attempts, would strengthen the case for a deeper correction.

Riva A. Nahar joins our team as a Crypto Journalist, covering cryptocurrency markets, blockchain developments, DeFi, and emerging trends across the digital-asset industry. With a focus on clear, accurate, and well-researched reporting, Riva brings a balanced perspective to fast-moving crypto news and market developments. Her work aims to make complex industry developments accessible while maintaining strong journalistic standards.
View all stories by Riva A. Nahar →