 BTC
 ETH
 USDT
 BNB
 XRP
 USDC
 SOL
 TRX
 FIGR_HELOC
 ZEC
 HYPE
 DOGE
 XMR
 USDS

Litecoin (LTC) Price Today: $75 Rejection Puts $60 Support and $70 Recovery Level in Focus
Litecoin (LTC) faces renewed selling pressure after retreating from the $71.50–$75 resistance zone, putting the $55–$59 support area in focus as traders assess whether the recovery can continue.


After rebounding from a low near $39.28, Litecoin climbed toward $75 before entering a correction. Although the broader recovery remains visible, short-term indicators suggest that bullish momentum has weakened. Defending key support levels and reclaiming nearby resistance will be important in determining the cryptocurrency’s next direction.
Litecoin Price Analysis: LTC Retreats From $75 Resistance
Litecoin’s recent recovery pushed its price from approximately $39.28 to the $71.50–$75 resistance zone. However, sellers regained control near this area, preventing a sustained breakout and triggering a pullback.
As of October 11, 2026, LTC is trading around $63.70–$64.10, according to the supplied market data. The cryptocurrency has lost approximately 9% over the past week but remains up around 19% over the past month. This divergence highlights the difference between its broader recovery and the latest correction.
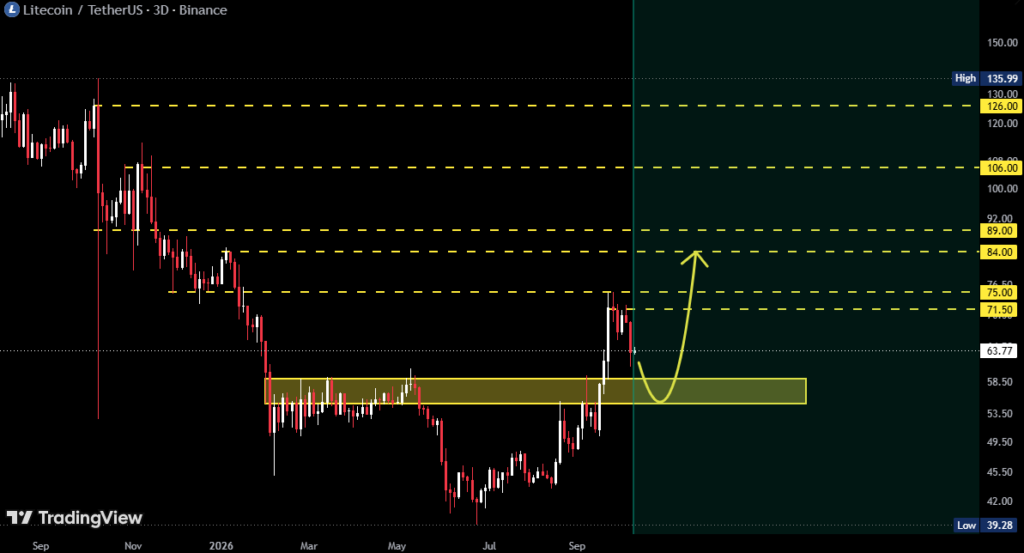
The rejection near $75 suggests that buyers have yet to establish sufficient momentum to overcome this resistance. Litecoin must recover intermediate price levels before another test of that zone becomes more convincing.
For now, the price action indicates a correction following a substantial advance. Whether this represents a temporary pause or a deeper reversal will depend on how LTC responds to the support levels below its current price.
$55–$59 Support Zone Remains in Focus
The $55–$59 region is central to the current Litecoin price analysis. According to the supplied chart commentary, this area previously acted as a consolidation zone before the cryptocurrency’s recovery accelerated.
If buyers defend this region, the pullback could develop into a retest of former support. Such a move could preserve the possibility of another advance, although support alone would not confirm a bullish reversal.
Before reaching that broader zone, Litecoin has several intermediate levels to navigate. The $63 area represents immediate support, followed by approximately $61.55 and the $60–$59.50 range. These levels may help determine whether the current correction remains contained.
A sustained decline below $59 would weaken the immediate recovery structure and increase attention on the lower end of the highlighted support range. If LTC approaches $55, market participants will likely assess whether buying demand is sufficient to stabilize the price.
A decisive breakdown below this broader zone would undermine the bullish outlook and raise the risk of further losses. These levels remain technical reference points, however, rather than guaranteed price floors.
Technical Indicators Show Mixed Momentum
Litecoin’s technical indicators present a mixed picture, with short-term weakness contrasting with a more constructive longer-term structure.
The daily Relative Strength Index (RSI) stands near 49 in the supplied data, placing it in neutral territory. This reading does not indicate a strong overbought or oversold condition. Meanwhile, the Moving Average Convergence Divergence (MACD) remains bearish, suggesting that downward momentum has not fully subsided.
LTC is trading below several short-term moving averages, including those used to assess near-term price direction. However, it remains above several longer-term daily averages in the supplied analysis. This combination is consistent with a correction within a broader recovery, although it does not guarantee that the upward trend will resume.
The $63 support area and the $65.50 resistance level are particularly relevant in the immediate outlook. A sustained move above $65.50 could improve short-term momentum, while a daily close below $63 would increase the possibility of a deeper retracement.
These indicator readings can differ across platforms depending on the selected timeframe, exchange data, and calculation settings. They should therefore be treated as analytical tools rather than independent trading signals.
Elliott Wave Structure Points to a Possible Correction
The supplied Elliott Wave analysis offers another interpretation of Litecoin’s recent price movement.
According to the analyst, the recovery from the earlier low can currently be interpreted as a three-wave A-B-C advance rather than a confirmed five-wave bullish impulse. The rally approached the $74 area before losing momentum, potentially marking the beginning of a higher-degree corrective phase.
Under this interpretation, the decline toward $60 could represent a fourth-wave correction. If that level attracts sufficient buying interest, LTC could attempt another advance, potentially forming a fifth wave.
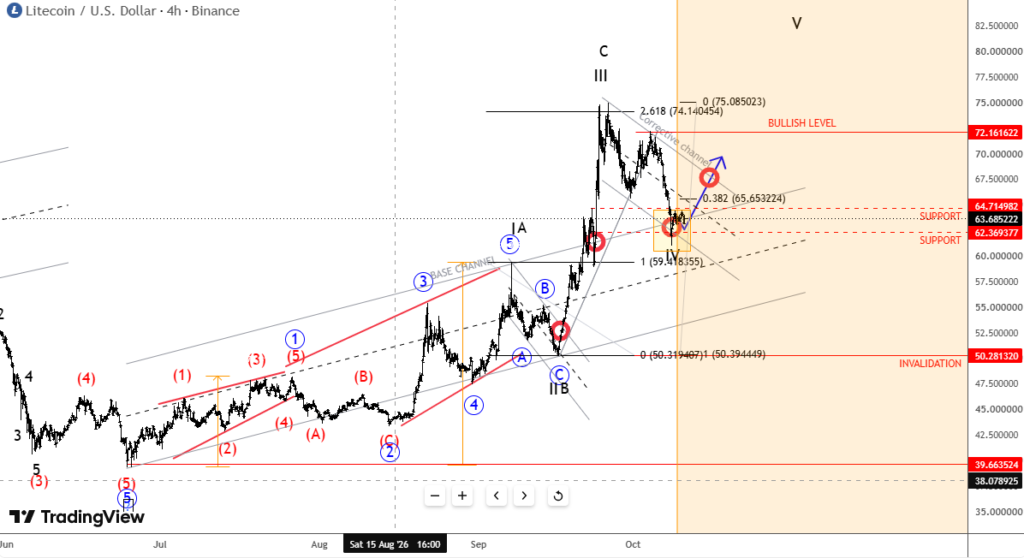
A rebound above the descending channel resistance near $70 would strengthen this scenario by indicating that buyers are regaining control. However, the wave structure remains provisional, and alternative interpretations are possible as new price data develops.
The downside scenario also requires attention. A sustained move below $59 would weaken the proposed recovery pattern, while a break below $50 would invalidate the specific bullish scenario described in the supplied analysis.
Elliott Wave projections are subjective and should not be treated as confirmed outcomes. Price confirmation remains essential before concluding the broader trend.
LTC Price Prediction: Key Levels to Watch
Litecoin’s near-term direction depends on whether buyers can stabilize the price and break above the 65.50–67.50 resistance zone. A sustained move above this range could open the way toward 69–70, followed by the broader 71.50–75 resistance area, which previously capped the advance.

On the downside, 63–61.55 represents immediate support, while the 55–59 zone remains important for the potential recovery structure. A decline toward 60–59 could test buying interest, whereas a break below the wider support zone may increase downside risks. A move below around $50 would invalidate the bullish Elliott Wave scenario outlined in the analysis.
What Could Influence Litecoin’s Next Move?
Technical factors are only part of the Litecoin price outlook. Broader cryptocurrency sentiment, market liquidity, and investor demand can also influence price movements.
Litecoin is a proof-of-work cryptocurrency launched in 2011. Its network targets block production approximately every 2.5 minutes and has a maximum supply of 84 million LTC. Periodic mining-reward reductions, known as halvings, are built into its issuance schedule. These characteristics help explain Litecoin’s monetary design but do not establish a reliable relationship between a halving and a particular future price.
Developments involving a potential Litecoin ETF may also influence investor attention. However, ETF-related expectations should be distinguished from confirmed regulatory decisions and actual investment flows. Without verified evidence of sustained inflows, such developments alone cannot establish the direction of LTC’s price.
Bitcoin’s performance and wider digital-asset sentiment are additional factors to monitor. A broader market downturn could place pressure on Litecoin even if its technical support initially holds. Conversely, improving market conditions could help LTC recover toward resistance.
Litecoin Price Prediction: Outlook for LTC
Litecoin’s rejection near $75 has shifted attention toward lower support, with the $55–$59 zone remaining an important reference for its broader recovery.
In the near term, the $63 area and the $65.50–$67.50 resistance band offer more immediate signals. A sustained recovery above resistance could bring $69–$70 back into focus, while continued weakness may expose support near $60 and potentially lower levels.
The bullish scenario remains conditional on buyers defending support and establishing renewed upward momentum. A decisive breakdown below the $55–$59 zone would weaken that outlook and increase the risk of further downside.
For now, Litecoin remains in a corrective phase following its recovery from earlier lows. A sustained move through key support or resistance should provide clearer evidence of its next direction. These projections are based on the supplied October 11, 2026, market data and technical commentary and should be reassessed as market conditions change.

Riva A. Nahar joins our team as a Crypto Journalist, covering cryptocurrency markets, blockchain developments, DeFi, and emerging trends across the digital-asset industry. With a focus on clear, accurate, and well-researched reporting, Riva brings a balanced perspective to fast-moving crypto news and market developments. Her work aims to make complex industry developments accessible while maintaining strong journalistic standards.
View all stories by Riva A. Nahar →