 BTC
 ETH
 USDT
 BNB
 XRP
 USDC
 SOL
 TRX
 FIGR_HELOC
 ZEC
 HYPE
 DOGE
 XMR
 USDS

Litecoin Price Forecast: Can LTC Break $75 Resistance and Climb Toward $80?
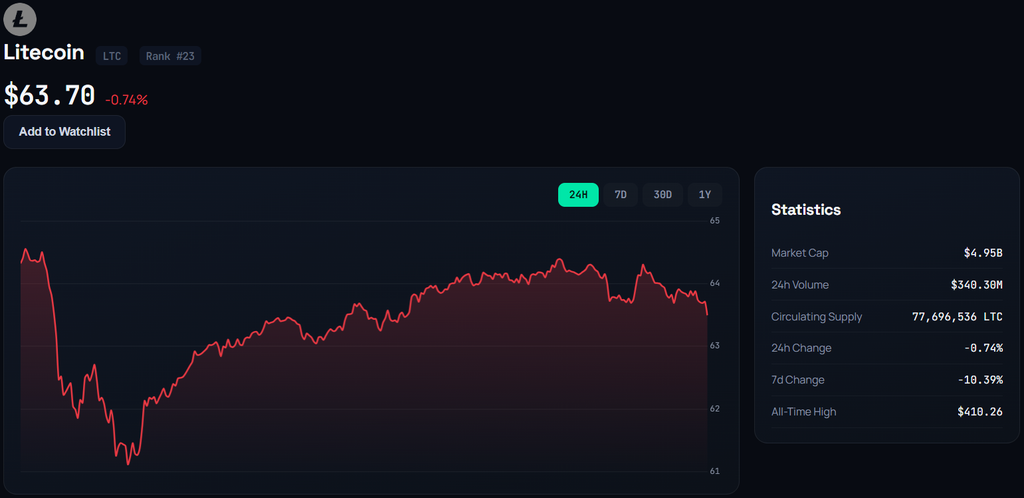
Litecoin is attempting to stabilize after retreating from its recent highs, with the $62–$63 region emerging as a critical technical area.


A successful defense of this support could help Litecoin price recover toward $67 and eventually challenge the $75 resistance barrier, while a breakdown would expose the cryptocurrency to further losses.
On October 10, 2026, Litecoin traded around $64 after rebounding from intraday lows near $61. Although the price remains above several medium- and long-term moving averages, weakening momentum indicators suggest that buyers have yet to regain firm control. The possibility of an advance toward $80 therefore depends on whether LTC can sustain its recovery and overcome the resistance levels ahead.
LTC Price Analysis: Fibonacci Levels Put $63 in Focus
Litecoin’s recent advance began after the cryptocurrency recovered from a low near $39.28. The rebound gathered momentum and carried LTC toward the 71.50–75.00 region before sellers triggered a correction.

Technical analyst @_CryptoSurf highlighted a retracement from the 0.5 Fibonacci level toward the 0.382 level following an approximately 90% rally over three months. The accompanying chart identifies support around $63, placing the current price near an important area for assessing the strength of the recovery.
Fibonacci retracement levels are commonly used to identify potential support and resistance during price corrections. In Litecoin’s case, the 38.2% retracement area around 62.18–63.00 overlaps with the Ichimoku Kijun level near $62.58, adding technical significance to this zone.
However, the presence of several indicators near the same price does not guarantee that support will hold. Buyers need to defend the area and push LTC back above nearby resistance to establish a stronger recovery signal.
Litecoin Forecast: Resistance Levels Between LTC and $80
The next phase of Litecoin’s price movement will depend on how the asset responds to several nearby technical barriers.
The first obstacle lies between $64.27 and $65.10, where recent price action and short-term moving averages create resistance. A sustained move above this band could shift attention toward 66–67, followed by the $68.85 pivot resistance identified in daily technical calculations.

The 71.50–75.00 region represents a more substantial hurdle. Litecoin previously encountered selling pressure around this range, and a return to it would test whether bullish momentum has recovered sufficiently to challenge the recent highs.
Trader @Crypt0Astronaut has identified a potential move toward $80 if Litecoin produces a strong rebound after retesting long-term resistance. That outlook remains conditional on a sustained breakout above $75 rather than a brief move through the level.
If buying pressure strengthens and the resistance zone gives way, $80 could become a relevant upside reference. Failure to clear the barrier, however, could leave LTC trading within a broad consolidation range.
Can Litecoin Bulls Defend the Current Recovery?
The medium-term technical structure remains constructive in some respects. Litecoin is trading above its 50-period exponential moving average near $59.80 and its 100-period and 200-period averages around 55.40–56.05. These averages suggest that the recent pullback has not erased the broader recovery structure.
Other indicators present a less decisive picture. The daily Relative Strength Index has been reported around 48–50, indicating relatively balanced momentum. The MACD histogram remains negative, while four-hour RSI readings around 33–37 point to weaker short-term conditions.
This divergence between longer-term price structure and shorter-term momentum suggests that Litecoin is still searching for direction. A recovery above 65–67, accompanied by stronger volume and improving momentum, would provide evidence that buyers are regaining influence.
Conversely, repeated rejection near short-term moving averages could prolong the correction. Traders may therefore look for confirmation from daily closing prices rather than relying on isolated intraday rebounds.
Downside Risks: What Happens if LTC Loses $62?
A sustained move below the 62–63 support area would weaken the bullish outlook and shift attention toward lower price levels.
The first potential support lies near $60.80. If that level fails, Litecoin could revisit the 58.65–59.00 region, where the lower Bollinger Band and the 50-period simple moving average provide additional technical references.
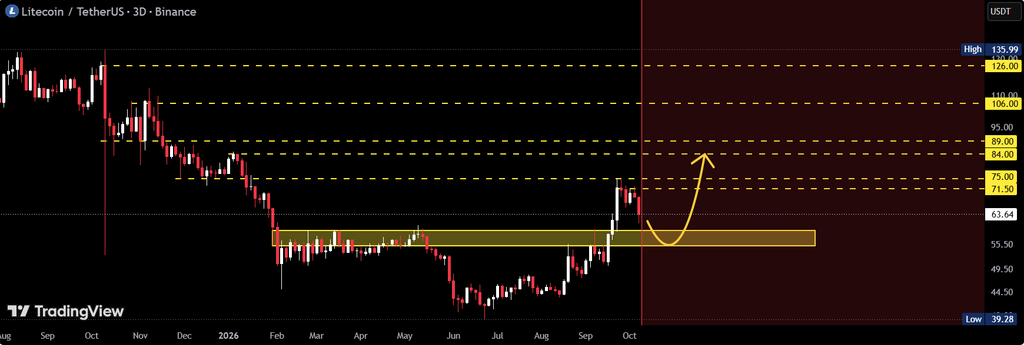
A deeper decline could bring the 55–59 range back into focus. This area previously served as a consolidation zone before Litecoin’s advance, making it important to the broader breakout-and-retest structure.
CryptoNuclear’s three-day chart analysis identifies this range as a key decision area. If LTC returns to it and buyers respond strongly, the price could establish a higher low and attempt another recovery. A decisive breakdown, followed by a failed attempt to reclaim the range, would instead suggest that selling pressure remains dominant.
Below $55, further support references include 51.50–46.50, $42.50, and the previous low near $39.28. These levels represent possible areas of interest if the correction deepens, not a forecast that Litecoin will necessarily revisit its earlier lows.
Key Signals to Watch Before the Next LTC Move
Several developments could help clarify Litecoin’s direction over the coming sessions.
- A sustained hold above 62–63: Maintaining this area would preserve the immediate recovery setup. A breakdown could expose lower support near $60.80 and $59.
- A breakout above $67: Reclaiming this region would indicate improving short-term price strength and put the 71.50–75.00 resistance band back in focus.
- A confirmed move above $75: A convincing breakout supported by stronger trading volume would improve the case for an advance toward $80. Without that confirmation, the upside scenario remains vulnerable to another rejection.
- Momentum improvement: The MACD histogram and RSI readings can help assess whether buying pressure is strengthening. A rising price accompanied by improving momentum would provide stronger confirmation than price appreciation alone.
The three-day chart also remains relevant because it captures the broader recovery and the potential retest of former resistance. A sustained move above key levels across multiple sessions would provide a more reliable signal than a short-lived rebound.
LTC Price Prediction 2026: Recovery or Extended Consolidation?
Litecoin’s outlook remains dependent on whether buyers can defend the 62–63 area and overcome the resistance levels above the current price.
The bullish scenario calls for LTC to recover through 65–67, retest 71.50–75.00, and potentially extend toward $80 if buying momentum strengthens. The recent recovery from the $39.28 low and the position of longer-term moving averages provide some support for this possibility, but neither confirms that another rally has begun.
The bearish alternative involves a sustained loss of $62, followed by tests of $60.80 and 58.65–59.00. A deeper correction could bring the 55–59 range into play, with further downside possible if that area fails to hold.
For now, the 62–63 zone is the immediate technical reference, while $75 remains the main barrier between Litecoin’s current price and the proposed $80 objective. Traders will need to assess support reactions, daily closes, and momentum indicators before determining whether the latest pullback is ending or developing into a broader reversal.

Jack Spencer is a financial journalist and crypto market analyst covering digital assets, blockchain innovation, and global market developments. His reporting focuses on cryptocurrency price trends, regulation, institutional adoption, and the evolving digital asset ecosystem.
View all stories by Jack Spancer →