 BTC
 ETH
 USDT
 BNB
 XRP
 USDC
 SOL
 TRX
 FIGR_HELOC
 ZEC
 HYPE
 DOGE
 XMR
 USDS

Litecoin (LTC) Price Prediction: LTC Holds $70 Support as Bullish Channel Faces $75 Resistance
Litecoin (LTC) is maintaining its position above the $70 support zone as its September recovery approaches a key resistance area, while elevated momentum indicators raise the possibility of short-term consolidation.


The Litecoin price has retreated from recent highs near $75 and is trading around $71. The broader technical structure remains constructive, supported by rising price action and moving averages, but the latest overbought readings suggest that further gains may require a period of consolidation.
Litecoin Price Analysis: Bullish Channel Remains Intact
Litecoin’s broader trend remains bullish, according to the supplied monthly chart analysis, although its shorter-term direction faces resistance. The chart identifies three distinct trends: a bullish primary channel, a bearish secondary trend near a resistance line, and a bullish local recovery moving toward that resistance.
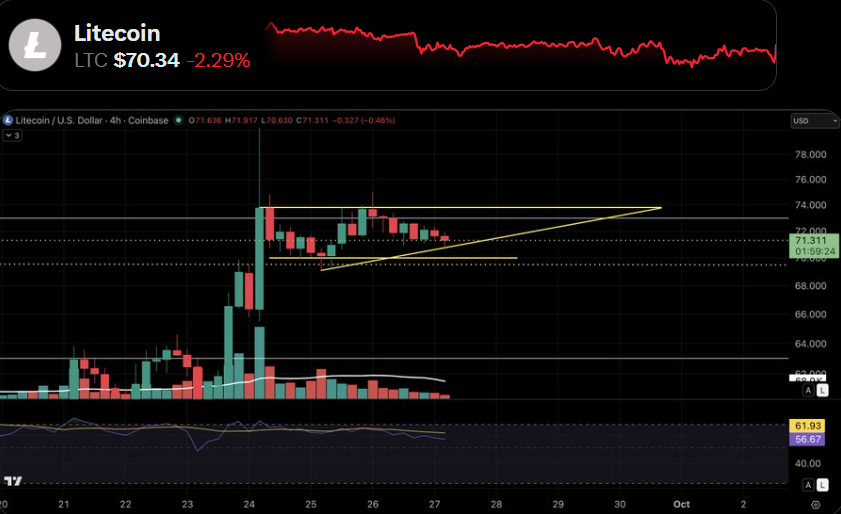
This combination places LTC at an important technical juncture. Holding above the $70 area would preserve the recent recovery structure, while a sustained move above $75 could bring the upper boundary of the near-term trading range into focus.
However, the market has not yet established a confirmed breakout. Price action around resistance, trading volume, and the broader cryptocurrency market’s behavior remain key factors in assessing whether the upward move can continue.
LTC Price Prediction: $70 Support and $75 Resistance in Focus
The 70–75 range has become an important area for the current LTC price prediction. Recent trading shows support around 69–70, while sellers have emerged near the 72–75 zone. A sustained move above $75 could signal stronger buying pressure, while a break below 69–70 may expose Litecoin to further downside toward the mid-to-high $60s.
The four-hour chart analysis also points to the possibility of extended sideways trading between the Fibonacci midpoint and the channel midpoint. Such consolidation would suggest that Litecoin is taking a pause after its recent advance rather than immediately establishing a new trend. Traders may therefore continue watching the $70 support and $75 resistance levels for clearer direction.
Overbought RSI Raises Short-Term Pullback Risk
Momentum indicators show that Litecoin’s recent advance has been strong, but several readings have moved into overbought territory. Daily Relative Strength Index (RSI) readings in the supplied data were around 80.9–83.8, while the Stochastic oscillator was in the upper 80s to low 90s.
The Commodity Channel Index (CCI) was also elevated, at approximately 146. Meanwhile, Stochastic RSI readings approached 97–100, indicating particularly strong recent momentum.
These measurements suggest that LTC has advanced rapidly relative to its recent trading history. However, overbought conditions do not automatically signal a reversal. In a strong trend, momentum indicators can remain elevated for an extended period.
The current readings therefore point to a potential pause or pullback rather than confirming that the broader recovery has ended. A decline in momentum alongside weakening volume or a break of support would provide additional information about the market’s direction.
Moving Averages Support the Broader Litecoin Forecast
Litecoin’s moving averages present a more constructive picture than its short-term oscillators. The supplied technical data places several short- and intermediate-term moving averages below the current price, including the 10-, 20-, 30-, and 50-period averages.
This alignment is consistent with the recovery that developed during September. Longer-term averages, including the 100- and 200-period measures, have also remained below the current market price in the reported snapshots.
The separation between price and these averages indicates that LTC has moved substantially above its earlier trading levels. While this supports the existing upward structure, it also means the market may be vulnerable to a return toward intermediate averages if buying pressure weakens.
The Hull Moving Average has occasionally produced short-term sell signals, illustrating the difference between the broader bullish trend and the more uncertain immediate outlook.
Litecoin Halving and Upcoming Developments
Litecoin’s supply schedule and planned ecosystem developments provide additional context for its longer-term outlook. Created in 2011 by Charlie Lee as a fork of Bitcoin’s source code, Litecoin uses a capped supply and periodic halvings that reduce the number of new LTC issued to miners.
The next Litecoin halving is anticipated around July 30–August 2, 2027, at block height 3,360,000. Under the protocol’s current schedule, the block reward is expected to decline from 6.25 LTC to 3.125 LTC.
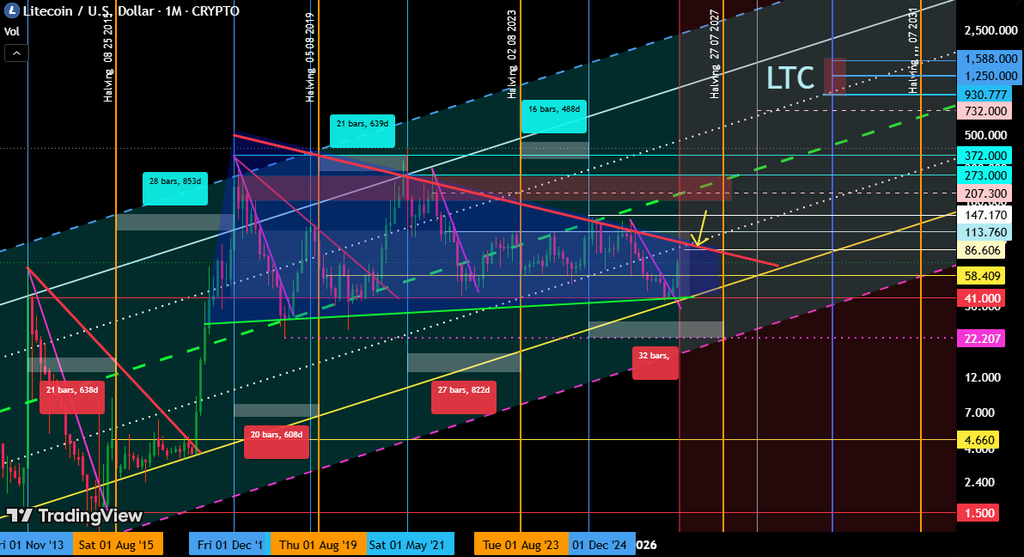
The supplied roadmap also identifies several developments to watch:
- AIBC World, November 2–5, 2026: A scheduled event in Rome featuring a dedicated Litecoin track.
- LitVM mainnet: An anticipated second-layer launch in the second half of 2026, intended to introduce Ethereum-compatible smart-contract functionality.
- Banking integration: A phased rollout involving Litecoin’s listing on meinKrypto, with custody services provided by Boerse Stuttgart Digital Custody.
These developments could influence attention toward Litecoin, but their potential market effects remain uncertain. Announced milestones and actual deployment and adoption are separate measures of progress.
Litecoin’s halving is also not a reliable standalone indicator of future price movements. Although reduced issuance changes the rate of new supply, market demand, Bitcoin’s performance, liquidity, and broader economic conditions can all affect LTC’s valuation.
Litecoin Price Prediction Today: What Traders Should Watch
Litecoin’s immediate outlook depends on whether the market can maintain support while approaching the $75 resistance zone. The current technical picture combines a positive moving-average structure with momentum readings that indicate a heightened risk of consolidation.
Three developments are particularly relevant:
- A sustained move above $75: This would indicate that buyers have overcome the immediate resistance area, although confirmation from trading volume and subsequent price action would still matter.
- Continued support near $70: Holding this zone would preserve the recent recovery structure and keep the existing bullish channel scenario in consideration.
- A break below $69: A sustained decline through immediate support would weaken the short-term setup and bring lower support areas into focus.
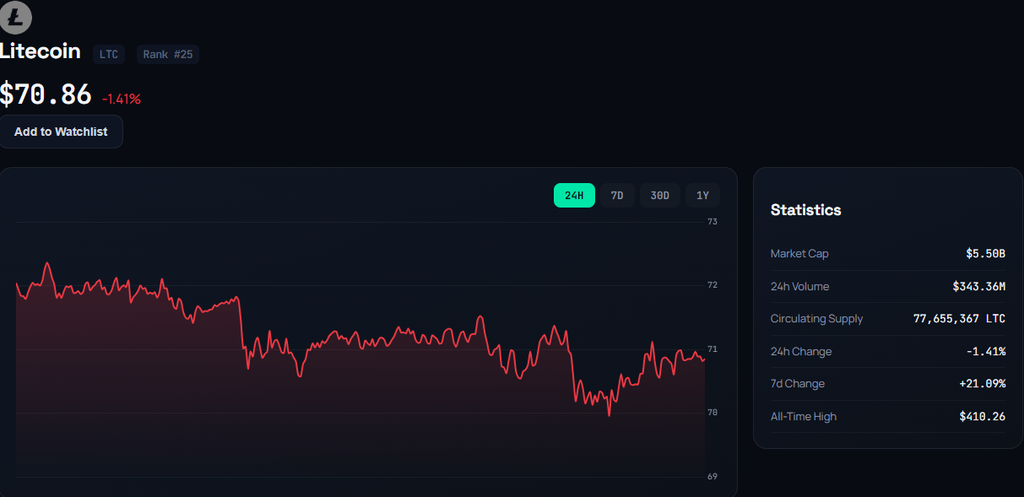
The supplied chart analysis also leaves open the possibility of continued sideways trading around the Fibonacci midpoint. Such a development would not necessarily invalidate the broader bullish structure, provided the important support areas remain intact.
Overall, Litecoin’s September recovery has improved its technical position, but the market has yet to resolve the immediate resistance challenge. The $70 support band, the $72–$ 75 resistance zone, and momentum indicators’ behavior remain the key reference points for assessing the next phase of price action.

Riva A. Nahar joins our team as a Crypto Journalist, covering cryptocurrency markets, blockchain developments, DeFi, and emerging trends across the digital-asset industry. With a focus on clear, accurate, and well-researched reporting, Riva brings a balanced perspective to fast-moving crypto news and market developments. Her work aims to make complex industry developments accessible while maintaining strong journalistic standards.
View all stories by Riva A. Nahar →