 BTC
 ETH
 USDT
 BNB
 USDC
 XRP
 SOL
 TRX
 FIGR_HELOC
 ZEC
 HYPE
 XMR
 DOGE
 USDS

Litecoin (LTC) Price Today: Litecoin Retreats From Recent Highs—Can $46 Hold?
Litecoin (LTC) is trading near the $46 level after giving back part of its recent recovery, as traders assess whether the cryptocurrency can maintain support following a brief breakout attempt


While the latest Litecoin price pullback has cooled bullish momentum, technical indicators suggest the broader market remains in a consolidation phase rather than a decisive trend reversal.
The LTC price action today reflects mixed market sentiment. Short-term indicators continue to show signs of stabilization, but longer-term technical signals indicate that sellers still hold the upper hand unless LTC can reclaim higher resistance levels.
Litecoin Price Today Tests Key Support
The Litecoin price has recently fluctuated between the mid-$46 and low-$48 range, with the latest move taking LTC back toward the lower end of that band. Despite the decline, the asset remains above an important support zone between $44 and $46 that has attracted buyers on multiple occasions throughout 2026.
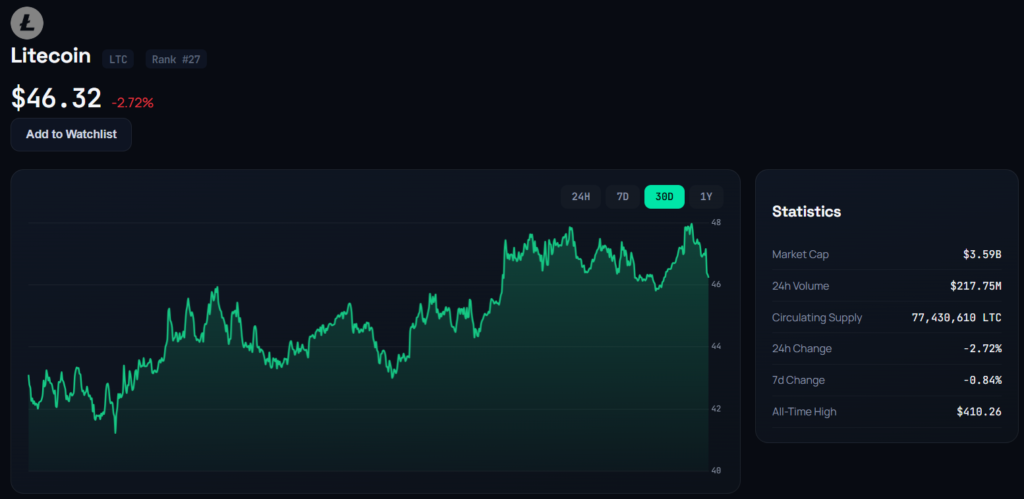
The recent retreat follows a modest recovery that developed alongside broader cryptocurrency market consolidation. Even so, Litecoin remains well below its longer-term highs, with year-to-date losses of roughly 38% and a decline of more than 58% over the past year.
Technical summary ratings from TradingView continue to lean neutral overall. Oscillators show little directional conviction, while moving averages present a split picture, offering short-term support but maintaining longer-term bearish pressure.
Litecoin Price Analysis Shows Mixed Momentum
The latest Litecoin price analysis suggests momentum remains balanced despite today’s weakness.
The 14-period Relative Strength Index (RSI) has generally remained between 50 and 58, indicating neutral to mildly bullish conditions without entering overbought territory. This leaves room for additional upside if buying interest returns.
Meanwhile, the MACD has hovered close to the zero line with occasional bullish crossovers. Analysts have also noted periods where the MACD line and signal line converged, creating a flat or “dead” MACD that often precedes stronger directional moves once momentum develops.
Other momentum indicators remain largely neutral. Stochastic Oscillator readings have fluctuated without generating strong reversal signals, while Williams %R, Commodity Channel Index (CCI), Awesome Oscillator, Ultimate Oscillator, and Momentum (10) all point to a market lacking a clear directional catalyst.
The Average Directional Index (ADX) continues to indicate weak-to-moderate trend strength, reinforcing the view that Litecoin remains range-bound.
Moving Averages Continue to Cap the Litecoin Price
Moving averages present one of the biggest challenges for the current LTC price.
Short-term EMAs and SMAs between the 5- and 20-period ranges remain close to the current market price, providing dynamic support during recent rebounds.
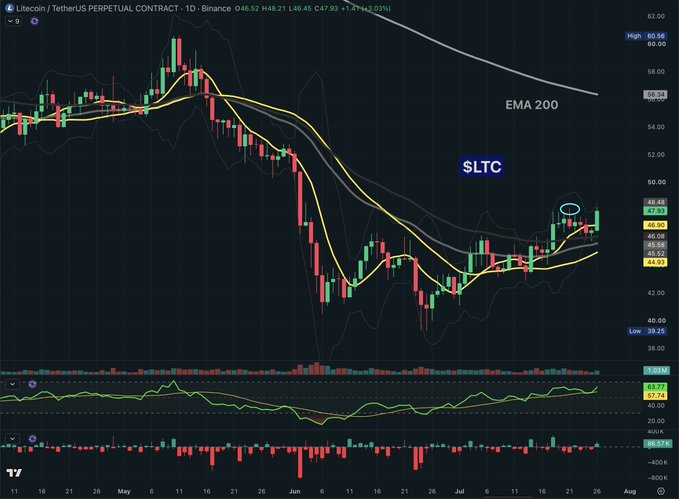
However, the broader trend remains constrained by longer-term resistance. The 50-period moving average has recently shifted into a more supportive role near the $44-$46 area, but the 100- and 200-period moving averages continue to trade well above the current price.
The longer-term “death cross,” where the 50-day moving average remains below the 200-day moving average, continues to reflect the broader bearish market structure despite recent stabilization.
As a result, sustained gains above the $48-$50 region would be needed before the technical picture begins to improve meaningfully.
Breakout Structure Faces Its First Major Test
Crypto trader @0xWhaleHL recently highlighted a bullish breakout structure developing on Litecoin’s 4-hour and daily Binance perpetual charts.
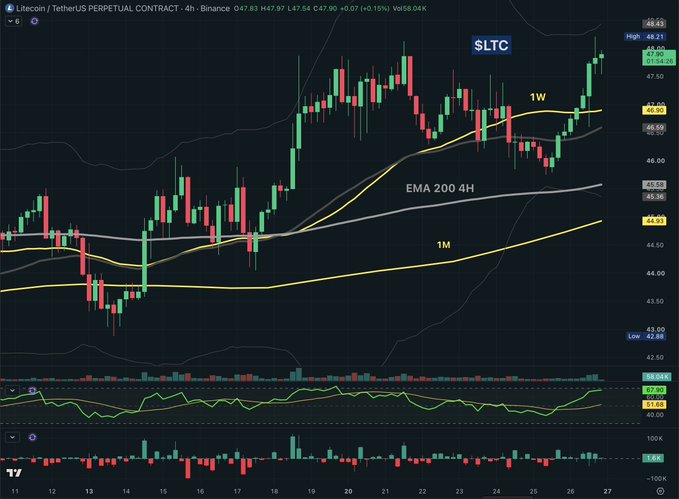
According to the analysis, Litecoin established a pattern of higher highs and higher lows while breaking above several key exponential moving averages during its recent advance. The daily chart also showed price pushing above a previous consolidation range, signaling improving short-term momentum.
The analyst additionally pointed to Bitcoin Cash (BCH) as another cryptocurrency worth monitoring, citing its historical relationship with Litecoin during periods of broader altcoin strength.
Today’s pullback, however, places renewed focus on whether LTC can maintain that breakout structure. Holding above nearby support could preserve the pattern, while a deeper decline would increase the likelihood of another period of sideways trading.
Key Support and Resistance Levels
The immediate support zone remains between $44 and $46, an area that has repeatedly attracted buying interest throughout the year. Below that, stronger historical support sits around $40-$42, where Litecoin previously found demand during earlier corrections.
On the upside, the first significant resistance lies between $48 and $50, followed by heavier selling pressure around $51-$52. Longer-term resistance remains near $56-$57, where multiple moving averages converge.
Classic pivot levels also place initial resistance in the upper $47-$48 region, while nearby support extends toward $45-$46.
These price zones are likely to determine whether Litecoin remains trapped in its current trading range or begins building a stronger directional move.
Litecoin Forecast Remains Dependent on Market Confirmation
The current Litecoin forecast remains balanced as technical indicators continue to send mixed signals.
Constructive momentum from the recent breakout attempt has not disappeared entirely, and oscillators continue to suggest that the market is not overextended. However, Litecoin remains below several important long-term resistance levels that have defined the broader corrective trend.
For now, traders are likely to watch whether LTC can defend the $44-$46 support area while generating enough buying volume to challenge resistance between $48 and $50 once again.
Until either support or resistance is decisively broken, the Litecoin price today continues to reflect a market in consolidation rather than one with a confirmed new trend.

Julia Thornton is a cryptocurrency reporter covering blockchain, digital assets, and financial technology. She reports on market developments, regulation, exchange activity, and industry trends, delivering timely and accurate coverage of the global crypto ecosystem.
View all stories by Julia Thornton →