 BTC
BTC  ETH
ETH  USDT
USDT  BNB
BNB  USDC
USDC  XRP
XRP  SOL
SOL  TRX
TRX  FIGR_HELOC
  HYPE
HYPE  DOGE
DOGE  USDS
USDS  RAIN
RAIN  LEO
LEO 
Litecoin (LTC) Price Prediction: Rising Wedge Setup Puts $50 in Focus as Bulls Defend Key Support
Litecoin is showing signs of renewed buying interest as LTC consolidates in the mid-$40s and traders monitor a developing technical structure for clues about its next move.


A rising wedge highlighted on the 4-hour Litecoin price chart has placed attention on the upper trendline, while another analysis points to a completed cup-and-handle breakout with immediate targets near $49.35 and $50.50.
The setup has emerged as Litecoin trades around $46-$47 following a recovery from its June lows. Buyers have managed to maintain a sequence of higher highs and higher lows on the shorter timeframe, but the broader technical picture remains mixed.
The latest Litecoin price analysis therefore presents two competing signals. Short-term chart patterns suggest improving momentum, while weekly and monthly technical readings remain less constructive. A confirmed breakout supported by stronger volume could strengthen the bullish case, but a failure to hold the rising support structure would raise the risk of another move toward the lower-$40s.
Litecoin Price Prediction: Rising Wedge Puts $50 in Focus
Crypto market commentator Crypto With Gopal highlighted a rising wedge formation on Litecoin’s 4-hour chart, with LTC trading near $46.41 when the analysis was published.
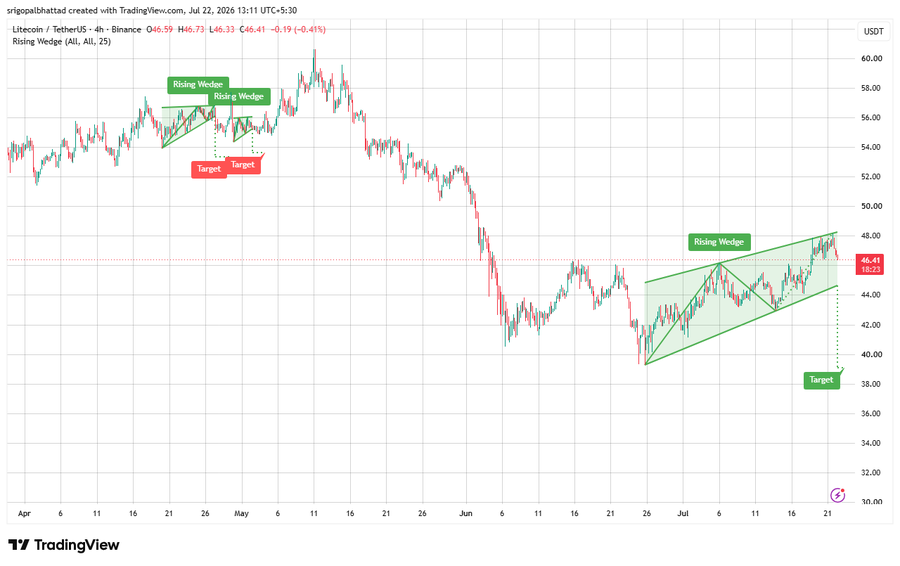
The chart shows price forming a series of higher highs and higher lows while buyers defend the lower trendline. The analyst described the structure as a potential setup for an “expansion move” if Litecoin breaks above the upper boundary with sufficient trading volume.
The rising wedge requires careful interpretation, however. While the cited analysis views the pattern as bullish in the current context, rising wedges can also precede bearish reversals if price breaks below the lower trendline. The direction of the eventual breakout, therefore, remains more important than the pattern itself.
For the current LTC price prediction, the $46-$47 area is an important short-term reference zone. Holding above the rising support trendline would preserve the current sequence of higher lows, while a decisive breakdown could weaken the structure.
A volume-backed move through resistance would provide stronger confirmation that buyers are gaining control. Without that confirmation, the pattern remains a developing technical setup rather than evidence of an established breakout.
LTC Price Prediction Targets $49.35 and $50.50
A separate analysis from Marcus Corvinus identifies a cup-and-handle pattern on Litecoin’s 8-hour Binance chart.

According to the analysis, LTC has already broken above the pattern’s resistance, with the price holding near $48. The chart marks $49.35 as the first upside target and $50.50 as a second target.
The cup-and-handle formation consists of a rounded recovery followed by a consolidation phase, or “handle,” before a potential breakout. Traders generally look for price to remain above the breakout area or successfully retest it as support.
That retest could be particularly important for the current Litecoin forecast. If LTC holds above the former resistance zone, it would provide additional technical confirmation of the breakout. Conversely, a failure to maintain the level could turn the move into a false breakout.
The $50 region also represents a psychologically significant threshold. A sustained move above it could shift market attention toward higher resistance levels, while rejection near $49-$50 would leave Litecoin within its existing trading range.
Litecoin Technical Analysis Shows Mixed Signals
TradingView’s technical snapshot presents a more cautious picture than the bullish chart patterns highlighted by individual analysts.
Litecoin was trading in the mid-$46 to low-$47 range in the reviewed data. The platform’s primary technical gauge was classified as neutral, reflecting a balance between conflicting signals.
The oscillator section also showed a neutral reading. RSI (14), Stochastic %K, CCI (20), ADX (14), Awesome Oscillator, Momentum (10), MACD, Stochastic RSI, Williams %R, Bull Bear Power and Ultimate Oscillator were either listed as neutral or unavailable in the referenced snapshot.
The absence of strong oscillator signals suggests that LTC was not displaying an extreme overbought or oversold condition at the time of assessment. It also means momentum indicators were not providing a strong independent confirmation of either a bullish reversal or a bearish breakdown.
This is relevant to any Litecoin price prediction because chart patterns alone may not be enough to establish the direction of the next major move.
Moving Averages Offer a More Constructive LTC Price Outlook
Moving averages provide a somewhat more supportive signal in the TradingView composite assessment.
Although individual 10-, 20-, 30-, 50-, 100- and 200-period EMAs and SMAs were shown as unavailable in the closed-market snapshot, the aggregate moving-average signal leaned toward buys.
This suggests that the broader short-term moving-average structure was more constructive than the oscillator readings. However, the lack of individual numerical values in the snapshot makes it difficult to identify precise moving-average support or resistance levels from that data alone.
The longer timeframes remain a source of caution. TradingView’s one-week and one-month ratings were both described as leaning toward sell signals.
The discrepancy between the shorter-term and longer-term readings highlights the difference between a potential near-term recovery and a confirmed broader trend reversal. Litecoin may be improving on lower timeframes without having fully reversed its larger market structure.
Litecoin Price Faces Resistance Between $46 and $52
The broader technical picture places several resistance levels between approximately $46 and $52, according to the analysis provided.
The $46-$47 region is currently acting as an important trading area, while the cup-and-handle analysis places immediate targets at $49.35 and $50.50.
This creates a series of technical checkpoints rather than a single breakout level. A move above $48 could bring $49.35 into focus, followed by the psychological $50 threshold and the $50.50 target identified by the chart analysis.
A sustained breakout through this broader resistance cluster would provide a stronger signal that Litecoin’s recovery is gaining traction.
On the other hand, rejection from these levels could leave LTC vulnerable to another test of support in the low-to-mid $40s.
Litecoin Price Analysis: Support Remains Critical
The bullish case for Litecoin depends heavily on buyers continuing to defend the rising support trendline identified on the 4-hour chart.
The recent price structure has produced higher highs and higher lows, which is generally viewed as constructive in the short term. However, that structure remains intact only while buyers continue to absorb selling pressure at progressively higher levels.

A breakdown below the rising trendline would weaken the setup and could shift attention toward demand zones around the low-to-mid $40s.
The broader market context also matters. Litecoin remains relatively close to its recent lows, meaning the asset has yet to establish a sustained long-term uptrend. The current recovery is therefore better viewed as an attempt to improve market structure rather than definitive evidence of a new bullish cycle.
LTC Price Prediction: Can Bulls Push Litecoin Above $50?
The current LTC price prediction centers on whether buyers can convert the recent recovery into a sustained breakout.
The rising wedge analysis highlights the upper trendline as the next major technical hurdle. Meanwhile, the cup-and-handle setup identifies $49.35 and $50.50 as potential upside targets if the breakout remains valid.
A move above $50 would represent a notable psychological and technical milestone. If accompanied by increasing volume and a successful retest, it could strengthen the argument that Litecoin is transitioning into a more sustained recovery phase.
However, a rejection near $49-$50 would leave the broader range intact. In that scenario, traders could refocus on the $46-$47 region and the lower support areas in the low-to-mid $40s.
The technical evidence therefore remains conditional. A breakout needs confirmation, while support needs to hold to preserve the current bullish structure.
Litecoin Forecast Remains Dependent on Breakout Confirmation
The broader Litecoin forecast remains mixed despite the improving short-term chart structure.
On one side, the 4-hour rising wedge and 8-hour cup-and-handle analysis show buyers attempting to establish control. The potential targets near $49.35 and $50.50 provide clear levels for traders monitoring the recovery.
On the other, TradingView’s neutral composite reading and the sell-leaning one-week and one-month ratings indicate that the broader trend has not yet fully turned bullish.
The lack of strong oscillator signals also suggests that momentum has yet to reach a level that would independently confirm a major breakout.
For now, the $46-$47 area remains an important reference point for Litecoin’s price analysis. Holding above this zone could keep the short-term recovery structure intact, while a break below key rising support could expose LTC to renewed downside pressure.
Litecoin Price Outlook
Litecoin is approaching a potentially important technical decision point as bulls attempt to defend the rising support structure and challenge resistance near $50.
The immediate upside levels are $49.35 and $50.50, based on the cup-and-handle analysis, while the rising wedge’s upper boundary remains the key breakout trigger in the 4-hour structure.
A volume-confirmed move above resistance would strengthen the bullish Litecoin price prediction and potentially signal a broader expansion in price. Conversely, a breakdown below the rising support trendline would invalidate the near-term bullish structure and put the low-to-mid $40s back in focus.
With the broader technical indicators still mixed, the next confirmed breakout or breakdown is likely to provide a clearer indication of Litecoin’s direction. Until then, LTC remains caught between improving short-term momentum and a longer-term trend that has yet to establish a decisive bullish reversal.

Julia Thornton is a cryptocurrency reporter covering blockchain, digital assets, and financial technology. She reports on market developments, regulation, exchange activity, and industry trends, delivering timely and accurate coverage of the global crypto ecosystem.
View all stories by Julia Thornton →
Responses
0