 BTC
BTC  ETH
ETH  USDT
USDT  BNB
BNB  USDC
USDC  XRP
XRP  SOL
SOL  TRX
TRX  FIGR_HELOC
  HYPE
HYPE  DOGE
DOGE  USDS
USDS  RAIN
RAIN  LEO
LEO 
Litecoin (LTC) Price Prediction: Is LTC Preparing for Its Most Important Breakout Attempt of 2026?
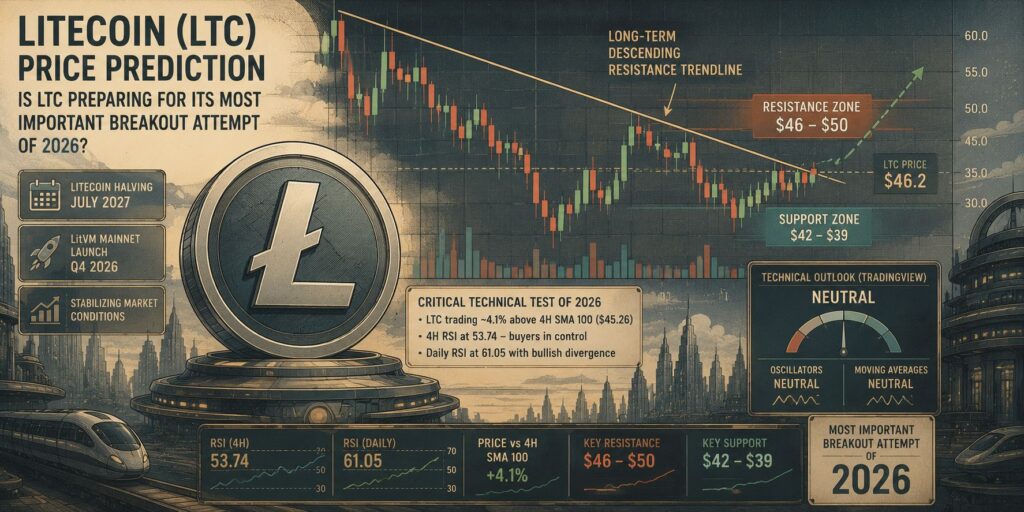
Litecoin is approaching a potentially important technical test as LTC price action moves toward a long-term descending resistance trendline that has capped previous recovery attempts.

After spending much of the year consolidating following a broader market decline, Litecoin is now trading in the mid-$40s, with short-term indicators showing some improvement.
The latest LTC price prediction centers on whether buyers can push the asset through the $46-$50 resistance area and establish a sustained breakout. A successful move could signal a shift in the medium-term structure, while another rejection would leave Litecoin vulnerable to a return toward the lower end of its established range.
Recent analysis from CoinCodex described the current setup as potentially “its most important technical test of 2026,” highlighting the combination of improving short-term momentum and a major overhead resistance trendline.
According to the cited analysis, LTC was trading approximately 4.1% above its 4-hour 100-period SMA at $45.26, while its 4-hour RSI had risen to 53.74. The readings indicate that buyers have gained some short-term momentum without pushing the market into traditionally overbought territory.
Still, the broader picture remains mixed. TradingView’s LTC/USD technical summary was rated Neutral, with both its moving-average and oscillator sections lacking a decisive bullish or bearish consensus in the cited snapshot. This leaves the market at a critical point where confirmation from price and volume could be more important than any single indicator.
Litecoin Price Analysis: Key Resistance Comes Into Focus
The immediate challenge for Litecoin is the resistance zone between approximately $46 and $50.
LTC has been testing a long-term descending trendline that has previously limited major recovery attempts. Such trendlines can become important technical barriers because repeated rejections often reinforce trader attention around the same price area.
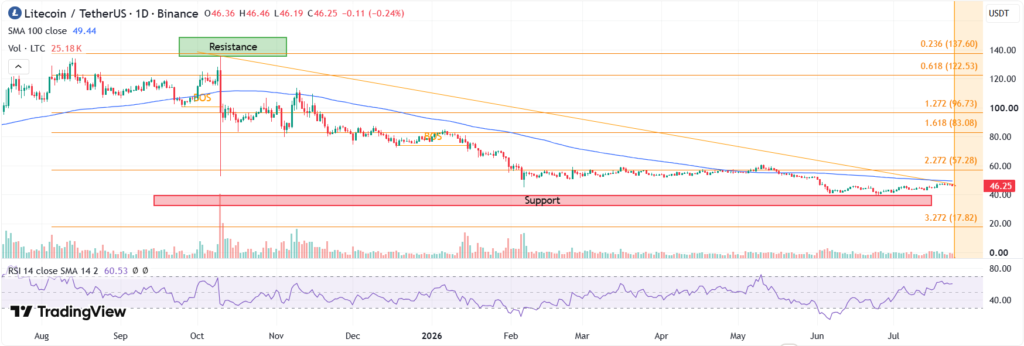
The current setup is therefore significant for the Litecoin price. A decisive break above the descending trendline, particularly if accompanied by stronger trading volume, could indicate that the multi-month corrective structure is beginning to change.
However, a brief move above resistance would not necessarily confirm a breakout. Traders would likely look for sustained acceptance above the trendline, followed by a successful retest of the former resistance as support.
The $49.52 area is another important level. CoinCodex’s analysis identified the 100-day SMA near that price as a key threshold that Litecoin needs to reclaim to strengthen the broader bullish case.
A sustained move above $50 could therefore provide a more convincing technical signal than a short-lived intraday spike.
LTC Price Prediction Gets Support From Improving RSI
Momentum indicators have started to provide some encouragement for LTC bulls.
The 4-hour RSI cited by CoinCodex was 53.74, placing the indicator above its neutral midpoint while remaining well below the conventional overbought threshold of 70.
The daily RSI presented an even stronger reading at 61.05. More importantly, the analysis pointed to a potential bullish divergence. Litecoin had previously recorded lower price lows while the daily RSI established higher lows.
Bullish divergence can sometimes indicate that selling momentum is weakening. However, it is a signal rather than confirmation of a reversal. Price still needs to break important resistance levels before the pattern can be considered technically validated.
Other TradingView-related data paints a more cautious picture. RSI readings across different timeframes have generally remained within a neutral range of roughly 46-60, while MACD signals have been mixed or close to neutral.
This divergence between individual timeframes reinforces the importance of monitoring the LTC chart rather than relying on one indicator. Short-term momentum has improved, but the broader trend has yet to produce a decisive bullish confirmation.
Litecoin Technical Outlook Remains Neutral
TradingView’s cited technical summary for LTC/USD showed an overall Neutral rating. The Oscillators and Moving Averages sections were also classified as Neutral in the referenced snapshot.
The platform noted “Market closed” and “No trades” at the time of access, with some individual indicator values unavailable. As a result, the aggregate rating should be treated as a snapshot rather than a definitive real-time trading signal.
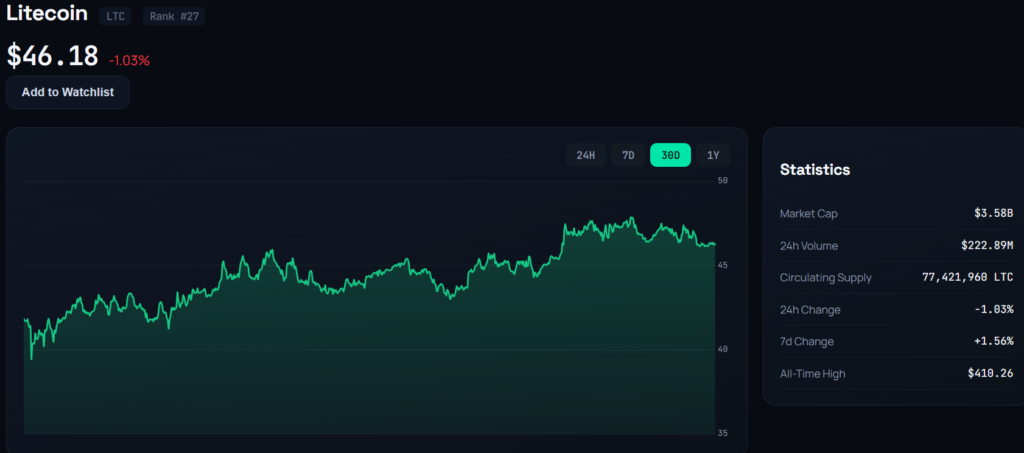
Litecoin (LTC) price chart. Source: ChainTelegram/CoinGecko
The broader technical picture remains mixed. Shorter-term moving averages are positioned closer to the current price, reflecting the recent consolidation. Meanwhile, longer-term averages remain higher and continue to act as potential overhead resistance.
This configuration is consistent with an asset attempting to recover within a broader corrective structure. A sustained move above the 50- and 100-period averages would offer stronger evidence of improving market structure.
Conversely, failure to hold near-term support could return LTC to its established trading range and potentially expose lower levels.
LTC Price Levels: $42 Support and $50 Resistance
The current LTC price is positioned between important technical support and resistance zones.
On the upside, the first resistance area is around $46-$47, followed by the broader $48-$50 region. The $50 level also carries psychological significance, making it a key area for market participants watching the LTC price prediction.
A confirmed breakout above $50 could open the way for a broader recovery and shift attention toward higher resistance levels.
On the downside, immediate support is located around $44-$42. A stronger demand zone has been identified around $41.75-$39, while a deeper breakdown could expose LTC to the $38 area or lower.
These levels create a relatively clear framework for the current market structure. Bulls need to overcome the $46-$50 resistance band, while bears would need to push LTC below the $42-$39 support region to significantly weaken the current consolidation pattern.
Volume will also be important. A breakout supported by expanding volume would generally provide stronger confirmation than a move occurring on thin activity.
Litecoin Halving and LitVM Add Long-Term Catalysts
Technical factors are not the only developments attracting attention to Litecoin.
The next Litecoin halving is currently scheduled for July 2027. Halving events reduce the block reward paid to miners and have historically been closely watched by cryptocurrency investors because of their potential implications for new coin issuance.
The upcoming event remains more than a year away, meaning its direct impact on short-term LTC price action is difficult to quantify. Nevertheless, it could become a more prominent narrative as the market approaches 2027.
Another development highlighted in the source analysis is LitVM, with an expected Q4 2026 mainnet launch. The project aims to introduce EVM-compatible smart-contract functionality to the Litecoin ecosystem, potentially expanding the network’s use cases beyond its traditional payments-focused role.
If delivered as expected, such developments could influence the long-term narrative surrounding Litecoin. However, their impact on LTC value will ultimately depend on adoption, network activity, ecosystem growth, and broader cryptocurrency market conditions.
For now, these catalysts provide longer-term context rather than an immediate explanation for daily price movements.
Litecoin Forecast: Can Bulls Break the Downtrend?
The short-term Litecoin forecast remains cautiously neutral, with some evidence of improving momentum but insufficient confirmation of a broader trend reversal.
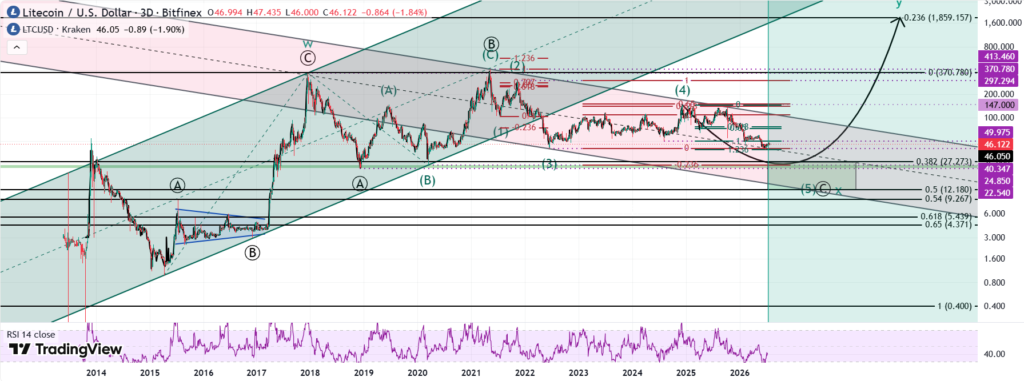
The bullish case is supported by LTC trading above the 4-hour 100-period SMA, an RSI of 53.74 on that timeframe, and the daily RSI’s recovery to 61.05. The potential bullish divergence on the daily chart also suggests that downside momentum may be losing strength.
However, Litecoin remains below important longer-term moving averages and is still testing a descending resistance trendline. TradingView’s neutral aggregate rating also indicates that the broader technical picture has not yet shifted decisively in favor of buyers.
CoinCodex’s one-month forecast cited in the source material placed LTC at approximately $46.45, reflecting a largely neutral outlook rather than projecting an immediate breakout.
The current structure could therefore develop in several ways. A confirmed breakout above $50 would strengthen the bullish scenario and potentially mark a significant change in the LTC price prediction. Failure at resistance, meanwhile, could keep Litecoin within its established range and bring $42-$39 support back into focus.
Litecoin Price Prediction: A Breakout Requires Confirmation
Litecoin is approaching a pivotal technical area, but the evidence does not yet confirm that a major breakout is underway.
The LTC price prediction remains dependent on the market’s ability to overcome the $46-$50 resistance zone. Short-term indicators have improved, with the 4-hour RSI at 53.74 and the daily RSI at 61.05, while a potential bullish divergence adds another constructive element to the setup.
At the same time, the broader technical structure remains neutral. Litecoin continues to face resistance from longer-term moving averages, and TradingView’s cited aggregate indicators do not show a clear consensus among bulls and bears.
The key levels are therefore relatively straightforward. A sustained move above $49.52-$50, ideally supported by stronger volume, would provide a more credible bullish signal. Conversely, a loss of $42, followed by a break below the $41.75-$39 demand zone, would weaken the recovery structure and increase downside risk.
With the 2027 Litecoin halving approaching and the expected LitVM mainnet launch adding a potential ecosystem catalyst later in 2026, the asset has several developments to monitor beyond its immediate chart structure. For now, however, the market’s next decisive move is likely to depend on whether LTC can finally overcome the long-term resistance that has repeatedly capped its recovery attempts.

Julia Thornton is a cryptocurrency reporter covering blockchain, digital assets, and financial technology. She reports on market developments, regulation, exchange activity, and industry trends, delivering timely and accurate coverage of the global crypto ecosystem.
View all stories by Julia Thornton →