 BTC
 ETH
 USDT
 BNB
 USDC
 XRP
 SOL
 TRX
 FIGR_HELOC
 ZEC
 HYPE
 XMR
 DOGE
 USDS

Sui Price Prediction: SUI Tests $0.67 Support, Eyes $0.75 Target as Technical Setup Signals Potential Recovery
SUI is trading near a technically important support area as sellers retain control of the broader trend, while short-term momentum indicators suggest the possibility of a rebound toward the $0.75 region.


The latest technical setup places the price of SUI around the $0.69–$0.71 area, with the $0.67–$0.68 zone emerging as an important level for determining whether the current decline can stabilize. TradingView’s aggregated technical readings continue to show a sell bias, particularly across moving averages, although oscillators are less bearish.
SUI Price Tests Key Support
The recent decline has brought SUI close to the $0.67 support region. This area is important because it sits above another historical demand zone around $0.64–$0.65.
TradingView’s technical summary currently shows an overall sell reading for SUIUSDT, with the one-week and one-month assessments also leaning toward sell signals. Moving averages provide the strongest bearish component of the reading, while the oscillator group remains comparatively neutral.
That combination suggests that the broader trend has not yet turned higher. However, the absence of extreme oversold conditions means the market is not necessarily showing the type of momentum exhaustion that would confirm a major bottom.
Recent market coverage has similarly highlighted SUI’s difficulty reclaiming longer-term averages. One recent analysis placed the 200-day EMA near $0.84 and noted that rebounds have struggled to hold above important resistance.
SUI Technical Analysis: RSI and MACD
The Relative Strength Index (RSI) has been reported around the low-to-mid 40s on the broader timeframe. That places the indicator in neutral to mildly weak territory rather than in an extreme oversold zone. As a result, RSI alone does not confirm a sustained reversal.
The MACD remains negative, retaining a sell bias and indicating that downward momentum has not been fully reversed. At the same time, shorter-term stochastic and related momentum indicators can show early signs of stabilization after declines.
The Average Directional Index (ADX), meanwhile, has been around the low-to-mid 20s to 30s in the referenced technical readings. This points to a market with meaningful trend strength but does not by itself establish that a new bullish trend has begun.
For the SUI coin price prediction, the practical implication is that traders would need to see improving momentum alongside a successful recovery of resistance levels rather than relying on a single oscillator.
$0.75 Resistance Becomes the Near-Term Test
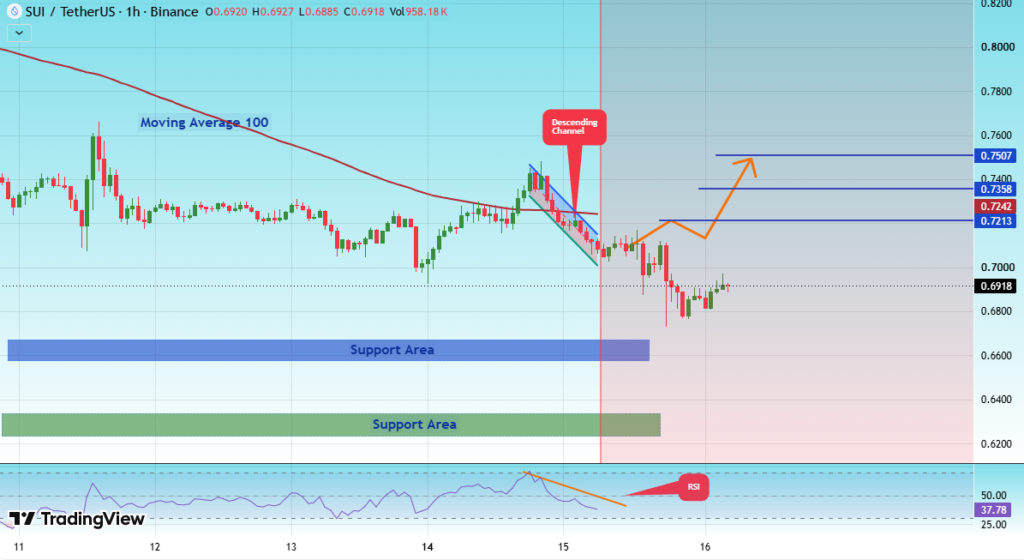
If SUI manages to defend $0.67 and recover the $0.70–$0.72 area, attention could shift toward the $0.74–$0.75 resistance band.
The supplied short-term chart analysis identifies $0.71 as an entry reference and outlines potential levels at $0.7213, $0.7362, and $0.75. These levels should be viewed as technical reference points rather than confirmed future prices.
A sustained move above $0.72 would improve the short-term structure. A break and hold above $0.75 would provide stronger evidence that buyers are regaining control of the immediate trend.
Above that area, the next resistance region extends toward approximately $0.78–$0.85, where longer-period moving averages and previous price activity could create additional supply.
Conversely, failure to hold $0.67 would weaken the recovery setup. The next area to monitor would then be around $0.64–$0.65, followed by the stronger $0.62 support identified in the shorter-term analysis.
SUI Chart Shows a Larger Falling-Wedge Structure
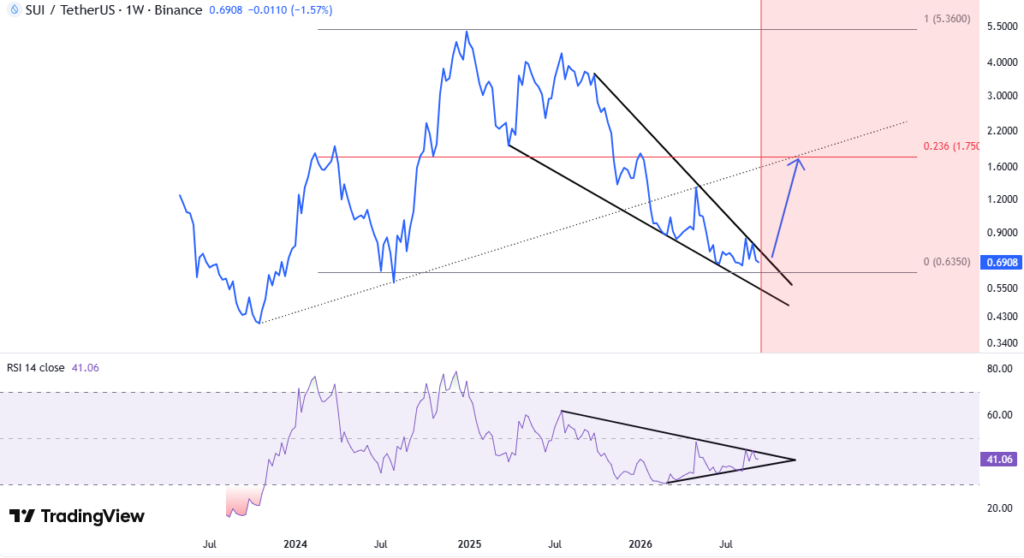
Beyond the immediate SUI price levels, another technical analysis points to a broader falling-wedge formation on the weekly chart.
The analysis also identifies a similar wedge structure in weekly RSI. In classical technical analysis, a falling wedge can precede a bullish breakout when price eventually closes above the upper trendline. However, the pattern remains unconfirmed until such a breakout occurs.
The same analysis compares SUI with Bitcoin and identifies a potential double-bottom structure around 0.000009 on the SUI/BTC two-week ratio. It also highlights a gravestone-doji formation in that area.
A candle pattern by itself does not establish a reversal. Its significance depends on where it appears and whether subsequent price action confirms the signal. Therefore, the SUI/BTC structure is better treated as supporting evidence rather than proof of a bottom.
The longer-term analysis projects a possible move toward the $1.75–$2 range if the weekly falling wedge breaks upward. That would represent a substantially larger move than the near-term $0.75 target, so the two scenarios should not be treated as equivalent forecasts.
Sui Crypto News and Market Context
SUI’s price action is developing against a broader cryptocurrency market that has recently experienced renewed volatility. Reuters reported on September 15 that Bitcoin and crypto-related stocks declined after the U.S. Senate failed to advance a comprehensive cryptocurrency regulatory bill. Bitcoin was reported near $75,908 at the time.
Broader financial conditions have also become less supportive for risk assets. Reuters reported that U.S. Treasury yields moved above 5% and that rising oil prices and renewed inflation concerns weighed on Wall Street.
These factors matter for SUI crypto because altcoins can experience larger price swings than the broader market when risk appetite changes. Consequently, a technically bullish setup on SUI can still fail if wider cryptocurrency sentiment deteriorates.
SUI Price Prediction: What Comes Next?
TradingView’s overall sell rating supports the bearish case, the strong sell signal from moving averages, and negative MACD momentum. SUI also remains below several longer-term averages, leaving the broader trend under pressure.
The recovery case depends primarily on support holding. If the $0.67–$0.68 area attracts sufficient buying interest, the price could first attempt to reclaim $0.70–$0.72 before testing $0.74–$0.75. A decisive move through that resistance would strengthen the short-term recovery structure.
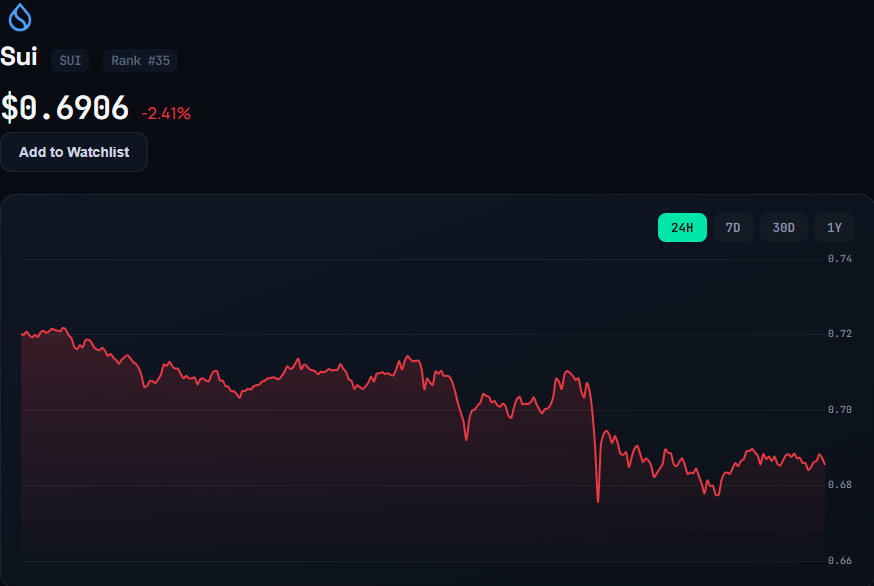
On the other hand, a sustained move below $0.67 would weaken the setup and expose the $0.64–$0.65 region, with $0.62 representing another significant support level from the supplied analysis.
Therefore, the current SUI price prediction is best understood as a conditional technical scenario rather than a fixed forecast. The $0.67 area is the key downside reference, while $0.75 represents the immediate upside level that bulls would need to challenge. Until price confirms a breakout and momentum indicators improve, the broader trend remains cautious.
As with other cryptocurrencies, technical ratings are snapshots that can change quickly as market conditions evolve. Longer-term projections, including targets substantially above $1, require confirmation from actual price structure rather than relying solely on historical chart patterns.

Riva A. Nahar joins our team as a Crypto Journalist, covering cryptocurrency markets, blockchain developments, DeFi, and emerging trends across the digital-asset industry. With a focus on clear, accurate, and well-researched reporting, Riva brings a balanced perspective to fast-moving crypto news and market developments. Her work aims to make complex industry developments accessible while maintaining strong journalistic standards.
View all stories by Riva A. Nahar →