 BTC
BTC  ETH
ETH  USDT
USDT  BNB
BNB  XRP
XRP  USDC
USDC  SOL
SOL  TRX
TRX  ZEC
ZEC  FIGR_HELOC
  HYPE
HYPE  DOGE
DOGE  XMR
XMR  LINK
LINK 
Litecoin (LTC) Price Prediction: FOMC Volatility Puts $50 Support and $54 Resistance in Focus
Litecoin (LTC) is approaching a pivotal technical zone as the Federal Reserve’s latest policy decision threatens to inject fresh volatility into cryptocurrency markets.


The Litecoin price has slipped back toward the $50 area after failing to sustain its recent recovery, leaving traders focused on whether the token can stabilize above key support or extend its decline toward lower levels.
FOMC Decision Arrives as Litecoin Enters a Tight Range
The Federal Open Market Committee’s September meeting is taking place as Litecoin trades close to the lower end of its recent range. The Fed’s policy announcement and subsequent comments from officials could influence broader risk sentiment, including Bitcoin and other major cryptocurrencies.

The Federal Reserve scheduled its September 15-16 meeting, with the policy decision and press conference due on September 16.
That timing gives the FOMC decision particular importance for LTC. The cryptocurrency has already been moving within a relatively narrow band, meaning a sudden change in market-wide volatility could produce a decisive break from its current structure.
Recent market commentary has also pointed to the sensitivity of cryptocurrencies to monetary-policy expectations. A Reuters poll published ahead of the meeting showed economists largely expecting the Fed to keep rates at 3.50%-3.75%, while uncertainty over the path of rates later in 2026 remained elevated.
LTC Price Analysis Points to $50 as the First Line of Defense
Litecoin recently traded around $50.90-$51.20, following a decline of roughly 3% over 24 hours. The latest session remained volatile, with LTC moving between approximately $50.54 and $52.97.
The broader 52-week trading range remains considerably wider, stretching from roughly $39.30 to $135.63. However, the immediate chart is considerably more compressed, with recent weekly highs concentrated around $55-$59.

This compression makes the $50 region particularly important. A sustained recovery from current levels would indicate that buyers are defending the lower portion of the recent range. A decisive breakdown, by contrast, would expose lower support zones.
TradingView’s daily technical summary currently shows a sell bias for LTCUSD. Moving averages are providing the clearest bearish signal, while oscillators offer a more mixed reading.
Moving Averages Keep Pressure on the LTC Price
Most of Litecoin’s medium-term moving averages remain above the current market price.
The 20-period SMA and EMA are positioned around $51.67-$51.68. The 50-period averages sit roughly between $52.46 and $52.79, while the 100-period averages are near $53.02-$53.40. The 200-period measures are also clustered around $52.99-$53.55.
This creates a sequence of resistance levels above LTC rather than a single technical barrier.
A rebound through $51.50-$52 would therefore be an initial improvement, but the cryptocurrency would still need to overcome the $52-$54 region to materially change the short-term structure.
The technical picture is also supported by a negative MACD reading of approximately -0.52. Meanwhile, the 14-period RSI is around 38-39, suggesting weak momentum without yet reaching deeply oversold conditions.
That combination leaves room for either continued selling or a stabilization attempt, depending on how price responds to the support zone.
Can Litecoin Reclaim $54?
The $54 region has emerged as a significant level on the upside.
Crypto analyst @cryptoWZRD_ identified $53.50 as near-term resistance while highlighting $50.50 as a key downside level. The analyst also noted that Litecoin has been moving in sympathy with Bitcoin’s recent weakness.

A separate TradingView setup from Sober_Investor focuses on the $54 area, asking whether Litecoin can maintain that level as the market searches for a clearer directional structure.
For LTC to improve its short-term technical profile, reclaiming $51.50-$52 would be an important first step. A subsequent move through $53.50-$54 would provide stronger evidence that buyers are regaining control of the near-term range.
Failure to clear that resistance, however, would leave the cryptocurrency below most of its medium-term moving averages.
The $49 Level Could Decide the Larger Structure
While $50 is the immediate psychological threshold, the more significant level from the higher-timeframe chart is around $49.
A TradingView analysis identifies $49 as the lower boundary of a broader Litecoin trading range. LTC recently moved beneath that level before attempting to return above it.
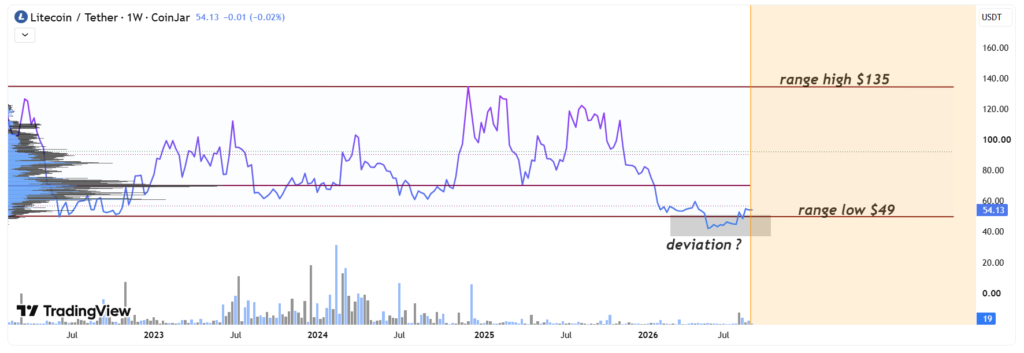
Such a move can represent a range-low deviation if the market subsequently establishes acceptance back inside the range. In practical terms, the structure remains dependent on Litecoin holding above $49 rather than simply touching the level during an intraday move.
A sustained recovery above the range low could reopen the possibility of a move toward the opposite side of the broader range. That analysis places higher-timeframe resistance around $135.
However, $135 should be viewed as a distant structural reference rather than an immediate LTC price target. Litecoin would first have to reclaim the $54 region and overcome several layers of resistance before the upper boundary becomes relevant.
Breakdown Below $49 Would Change the Setup
The bearish alternative is a sustained loss of the $49 range low.
Such a move would undermine the deviation structure and indicate that the market is no longer successfully reclaiming the previous range. The focus could then shift toward lower historical support.
The September 15 technical commentary cited approximately $42 as a major support level. This is considerably below the current trading zone and would represent a deeper correction if LTC eventually moved toward it.
The $50.50-$50.70 area is also important in the immediate timeframe. A decisive move beneath that band would reinforce the existing bearish momentum and make a retest of $49 more significant.
For that reason, intraday wicks around $49 may provide less information than sustained closes below or above the level.
Litecoin ETF Provides a Broader Market Backdrop
Technical factors are not the only development relevant to the Litecoin market.
Institutional access to LTC has also expanded through exchange-traded products. The Canary Litecoin ETF, trading under the ticker LTCC, began trading on Nasdaq in October 2025, according to filings with the U.S. Securities and Exchange Commission.
The fund’s SEC filing states that its shares commenced trading in October 2025 and are designed to provide investors with exposure to Litecoin held by the trust.
The existence of a spot Litecoin ETF provides another layer of market infrastructure around LTC. However, its presence does not determine short-term price direction. Liquidity, Bitcoin’s performance, broader risk sentiment, and macroeconomic expectations can still exert significant influence on the token.
Litecoin Price Prediction: Key Levels to Watch After the Fed
The immediate Litecoin setup can be framed around several technical thresholds rather than a single directional call.
On the downside, $50.50-$50.70 is the first area to monitor, followed by the broader $49 range low. A sustained breakdown through $49 would weaken the higher-timeframe deviation structure and put lower support, including the $42 area, back into focus.
On the upside, $51.50-$52 represents the first recovery hurdle. Above that, $53.50-$54 becomes the more important resistance zone. A sustained move beyond $54 would improve the short-term technical structure and could shift attention toward higher levels.
The FOMC decision adds an important macro catalyst to this setup. Because LTC is currently trading close to several tightly clustered technical levels, the market’s reaction to the Fed could produce a sharper move than recent sessions.
The subsequent closing prices may ultimately matter more than the initial volatility. Holding above $49 would preserve the broader range-recovery structure, while a sustained break beneath it would signal that Litecoin’s recent support has failed.
For the current Litecoin price prediction, therefore, the key question is less about forecasting a specific destination and more about determining which side of the $49-$54 structure eventually gains control.

Jack Spencer is a financial journalist and crypto market analyst covering digital assets, blockchain innovation, and global market developments. His reporting focuses on cryptocurrency price trends, regulation, institutional adoption, and the evolving digital asset ecosystem.
View all stories by Jack Spancer →