 BTC
 ETH
 USDT
 BNB
 XRP
 USDC
 SOL
 TRX
 FIGR_HELOC
 ZEC
 HYPE
 DOGE
 XMR
 USDS

Litecoin (LTC) Price Prediction: $61.50 Support Faces Breakdown Risk as $65–$66 Resistance Caps Recovery
Litecoin (LTC) faces renewed selling pressure as its price nears the $61.50 support level, while resistance between $65 and $66 continues to cap recovery attempts.


The latest technical outlook highlights the Litecoin price caught between short-term bearish momentum and a broader recovery structure that has yet to be fully invalidated.
Traders are watching whether LTC can defend its current support zone or continue declining toward lower levels. Bitcoin’s broader market direction remains another important factor in determining Litecoin’s next move.
LTC Price Prediction: $61.50 Support Remains Critical
Crypto analyst @cryptoWZRD_ described Litecoin’s latest daily close as bearish, noting that both LTC and the LTC/BTC pair faced selling pressure despite intraday volatility.
The analyst identified $66.20 as an important resistance threshold and $61.50 as the key downside level. According to the outlook, holding above resistance could create conditions for a potential long setup, whereas a breakdown below support could signal further weakness.
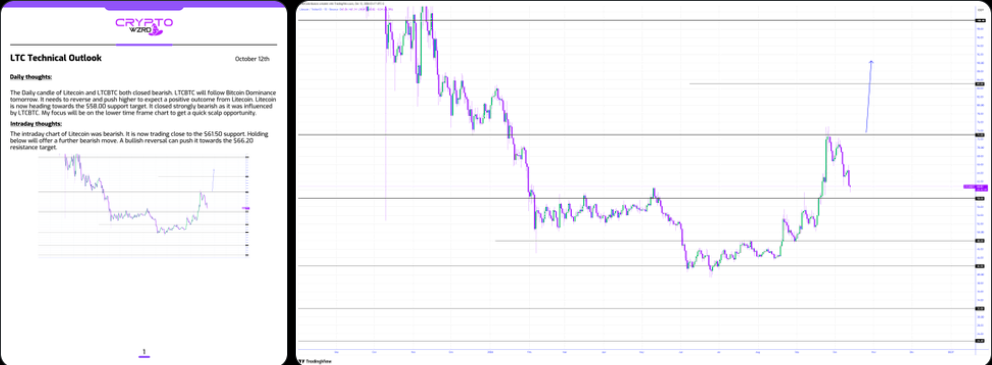
The analysis also identified approximately $58 as a potential downside target if selling pressure intensifies. However, this level remains a technical scenario rather than a confirmed price destination.
These thresholds provide a framework for the current Litecoin price analysis. A sustained move above $66.20 would weaken the immediate bearish outlook, while a decisive break below $61.50 would increase the risk of a deeper correction.
Technical Indicators Reflect Short-Term Weakness
Litecoin’s technical structure shows signs of weakening momentum across shorter timeframes. Several momentum indicators and moving averages point to continued selling pressure, although the broader picture is not uniformly bearish.
The Relative Strength Index (RSI) on the daily timeframe has been reported in the low-to-mid 40s, suggesting that buying momentum remains subdued without necessarily placing the market in deeply oversold territory. Shorter timeframes have shown weaker readings, reflecting the recent pullback.
The Moving Average Convergence Divergence (MACD) has also leaned bearish in recent technical snapshots, with negative momentum readings indicating that the recovery has lost strength. Meanwhile, several short-term moving averages remain above the current price, creating additional resistance.
Longer-period averages offer a more balanced perspective. The 50-day moving average has been reported around the $58–$60 region, while the 100-day and 200-day averages sit at lower levels in some market snapshots. These averages may help traders assess whether the recent decline represents a temporary correction or a more sustained reversal.
Indicator readings vary by exchange, timeframe, and calculation method. They should therefore be treated as supporting evidence rather than standalone signals.
$65–$66 Resistance Limits Recovery Attempts
The $65–$66 area is the immediate recovery barrier for Litecoin. Reclaiming this zone could help stabilize sentiment and bring higher resistance levels back into focus.
A sustained move above $66.20 would provide stronger evidence that buyers are regaining control of the short-term structure. In that scenario, traders could monitor the $67–$70 region, followed by the previous swing-high area around $71–$75.
However, an intraday move above resistance would not automatically confirm a breakout. Price acceptance above the zone, trading volume, and follow-through would help determine whether the recovery has sufficient strength.
If Litecoin fails to reclaim the resistance band, sellers could retain control of the near-term trend. Repeated rejection near this area would leave the $61.50 support level exposed to another test.
Can Litecoin Hold Its Broader Recovery Structure?
A separate technical analysis offers a more constructive interpretation of Litecoin’s chart. The analyst behind the shared chart noted that LTC had reclaimed a multi-year trendline and was attempting to retest it as support.
The analysis also raised the possibility of bullish divergence on both the RSI and MACD, provided the recent higher high in price remains valid. Bullish divergence occurs when price and momentum indicators develop contrasting structures that may suggest selling pressure is weakening.

The analyst described the setup as potentially attractive because a stop-loss could be placed below $60. However, this represents an individual trading opinion, not confirmation that Litecoin has established a durable bottom.
The distinction between the two technical views is important. One emphasizes the immediate risk of a breakdown below $61.50, while the other focuses on the possibility that the broader trendline remains intact. Both scenarios depend on how price behaves around nearby support and resistance.
Bitcoin Sentiment Could Influence LTC’s Next Move
Litecoin’s short-term direction may also depend on the wider cryptocurrency market, particularly Bitcoin. As the original technical outlook emphasized, broader Bitcoin sentiment could influence whether LTC stabilizes or extends its decline.
A stronger Bitcoin market could improve conditions for a Litecoin recovery, although it would not guarantee that LTC clears its own resistance levels. Conversely, renewed weakness in Bitcoin could place additional pressure on Litecoin’s support.
Traders may therefore monitor Bitcoin’s price action alongside LTC’s key technical levels rather than interpreting Litecoin’s chart in isolation.
Litecoin Price Prediction: Levels to Watch
The immediate outlook remains dependent on whether Litecoin can defend $61.50 or reclaim the $65–$66 resistance band.
Support at $61.50: Holding this level could help LTC consolidate and attempt another recovery.
Support below $60: A sustained move beneath the $59–$60 area could expose the market to further downside, with approximately $58 emerging as a potential technical target.

Resistance at $65–$66.20: Reclaiming this zone could improve the short-term structure and bring $67–$70 into focus.
Higher resistance at $71–$75: This region represents a broader recovery hurdle based on recent swing highs.
These levels are reference points, not guaranteed turning points. A confirmed break, trading volume, and broader market conditions will help determine which scenario develops.
Conclusion
Litecoin remains at a technically important point, with $61.50 support facing pressure and the $65–$66 resistance band limiting recovery attempts. Short-term momentum indicators lean bearish, but the broader trendline analysis leaves room for a recovery scenario if support holds.
For the current LTC price prediction, the clearest signal will come from a sustained move beyond either side of the immediate trading range. A breakdown below $61.50 would increase downside risk, while a convincing reclaim of $66.20 would provide evidence of improving momentum. Until either move is confirmed, Litecoin’s near-term direction remains uncertain.

Riva A. Nahar joins our team as a Crypto Journalist, covering cryptocurrency markets, blockchain developments, DeFi, and emerging trends across the digital-asset industry. With a focus on clear, accurate, and well-researched reporting, Riva brings a balanced perspective to fast-moving crypto news and market developments. Her work aims to make complex industry developments accessible while maintaining strong journalistic standards.
View all stories by Riva A. Nahar →