 BTC
BTC  ETH
ETH  USDT
USDT  BNB
BNB  XRP
XRP  USDC
USDC  SOL
SOL  TRX
TRX  ZEC
ZEC  FIGR_HELOC
  HYPE
HYPE  DOGE
DOGE  LINK
LINK  XMR
XMR 
Worldcoin (WLD) Price Prediction: Can WLD Reclaim $0.70 Before Targeting Its Former Highs?
Worldcoin (WLD) is attempting to recover from one of the deepest drawdowns among major crypto assets, with the token now trading around $0.44 after spending much of 2026 near historic lows.


The latest Worldcoin price rebound has brought short-term technical indicators back into positive territory, although the broader trend remains defined by substantial losses from its 2024 peak.
WLD’s recovery has also renewed attention on the $0.40 region, which one market analyst described as a long-term “liquidity pool.” The area has developed after a prolonged decline, but turning that base into a sustained reversal would require stronger demand, improving market structure, and the ability to absorb additional token supply.
Worldcoin Price Rebound Puts $0.70 Back on the Chart
The first major hurdle for Worldcoin is not its former all-time high but the intermediate resistance created during its 2026 recovery. Worldcoin previously advanced from roughly $0.27 to around $0.70 after an OTC transaction involving a large number of tokens.
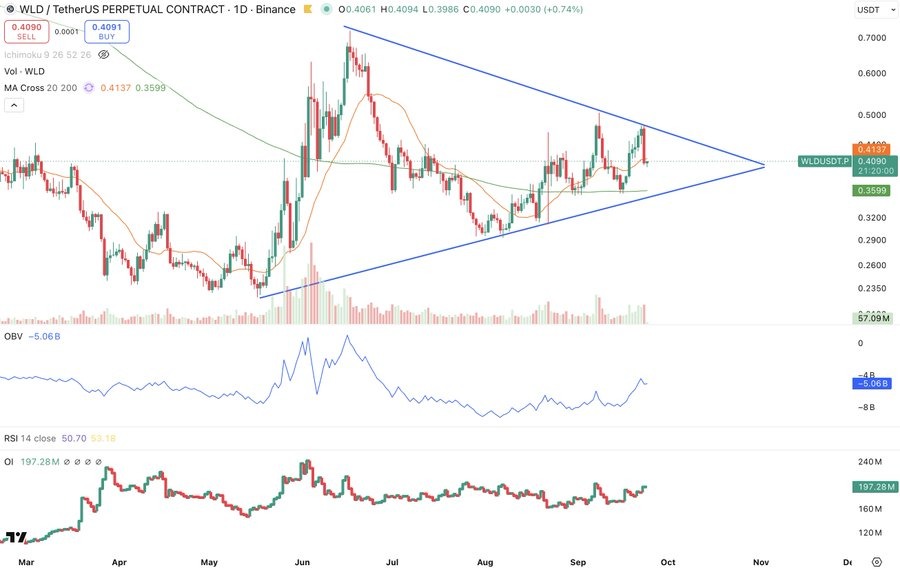
@LeMacroCap, a PhD economist who tracks the asset, highlighted this price history while discussing concerns surrounding the March 2026 OTC sale. The transaction involved approximately 239 million WLD at an average price near $0.27.
The subsequent move toward $0.70 provides an important reference point for the current market structure. Reclaiming that level would represent a substantially smaller recovery requirement than attempting to return immediately to the 2024 peak.
Recent market data shows Worldcoin trading near $0.43-$0.45, with September sessions producing significant short-term swings. Historical data shows the token moving from a September 17 close near $0.384 to approximately $0.458 on September 21 before retreating toward $0.406 and recovering again.
Why the $0.40 Area Matters for WLD
The $0.40 region has become a focal point because it sits close to the current trading range after an extended decline.
@0xVertix described the area as a “liquidity pool” in a weekly-chart analysis. The post noted that Worldcoin had fallen approximately 96% from its March 2024 all-time high near $11.82 to levels around $0.40.
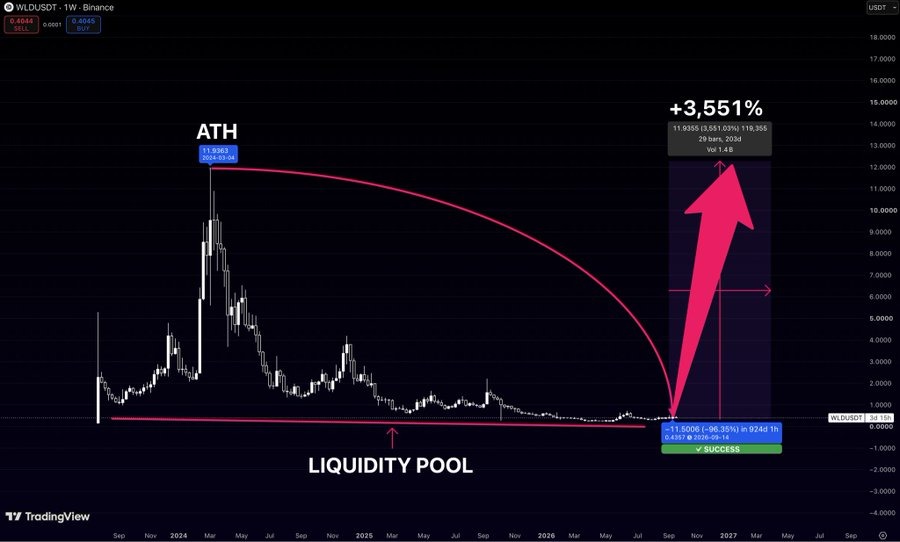
The analysis highlighted the potential magnitude of a full-cycle recovery rather than establishing a specific price target. A move of more than 3,500% from approximately $0.40 would place WLD around $14.40, which would exceed its previous record high.
That calculation illustrates the scale of the proposed scenario. A return to the former $11.82 peak would itself require a gain of roughly 2,600% from $0.44. Therefore, the 3,500% figure should be viewed as a hypothetical recovery calculation rather than an established market target.
Triangle Formation Keeps Breakout in Focus
The short-term WLD chart is showing a different structure from the long-term recovery thesis.
A Binance perpetual chart referenced by @LeMacroCap shows Worldcoin consolidating around $0.41 inside a triangle. The chart also shows rising On-Balance Volume and Open Interest, suggesting that trading activity and derivatives positioning have increased during the consolidation phase.
A triangle can eventually resolve in either direction, meaning the pattern alone does not establish a bullish breakout. Price confirmation remains necessary.
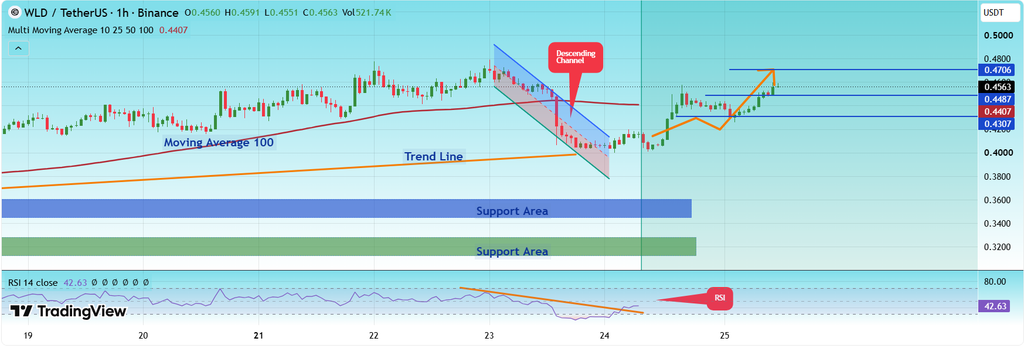
Another TradingView analysis by CryptoAnalystSignal identified a bearish channel on the one-hour timeframe. The analysis placed the token near the lower boundary of that channel and identified a potential rebound toward horizontal resistance.
The same setup identified $0.3450 as initial support and $0.3154 as a deeper support zone. WLD has previously reacted around the latter level, making it an important area if the current recovery loses momentum.
Moving Averages Give WLD a Short-Term Boost
The latest technical readings show WLD trading above several widely followed moving averages.
The 5-, 10-, and 20-period averages were clustered around $0.434-$0.440, while the 50-period averages were positioned near $0.427-$0.434. The 100-period averages were around $0.433-$0.441, and the 200-period averages were close to $0.428-$0.429.
This alignment has produced predominantly buy readings across the moving-average group. However, technical indicators are measurements of current market conditions and can change rapidly as price moves.
Momentum indicators also show a mixed but improving picture. RSI readings were generally in the mid-50s to low 60s, while MACD remained positive. Stochastic indicators were less consistent, with some readings approaching overbought conditions.
The combination suggests that short-term momentum has improved without providing confirmation of a longer-term trend reversal.
Token Supply Remains a Key WLD Risk
Supply remains one of the most important factors when assessing Worldcoin’s long-term price structure.
In March 2026, World Assets, a World Foundation subsidiary, disclosed $65 million of OTC WLD sales involving four counterparties. Approximately 239 million tokens were sold at an average price of about $0.27.
The transaction took place when WLD was trading close to its record low. The subsequent recovery toward $0.70 demonstrated that the transaction did not prevent a short-term price rebound.
However, the event remains relevant because Worldcoin has a large scheduled token supply. The World Foundation said in April 2026 that approximately 4.9 billion WLD, or 49% of the initial 10 billion token supply, had been unlocked, with roughly 3.3 billion circulating at the time.
The foundation also announced that the aggregate daily unlock rate would decline by 43% in July 2026, from approximately 5.1 million to 2.9 million Tokens.
According to World Network’s tokenomics documentation, the initial WLD supply is capped at 10 billion, while distribution and unlock schedules extend over a long period.
WLD Price Levels Traders Are Watching
At the current price range, Worldcoin faces several closely grouped technical levels.
Classic pivot calculations place the central pivot near $0.438. Immediate resistance appears around $0.441-$0.445, while support is concentrated near $0.432-$0.436.
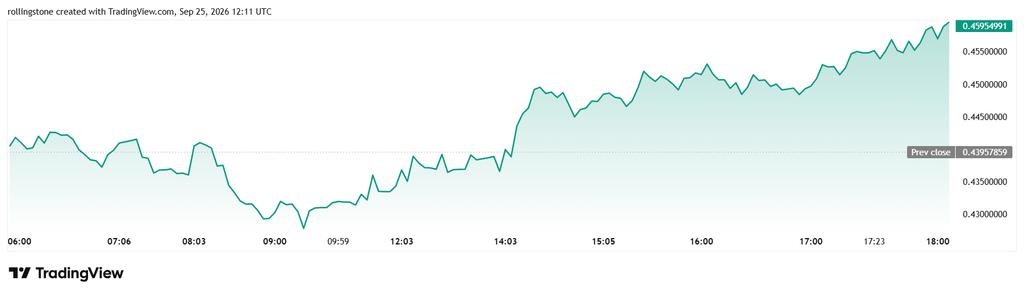
A sustained move above $0.445 could shift attention toward the next resistance areas. Conversely, a break below $0.432 would put greater emphasis on the $0.40 region.
If selling pressure intensifies, the one-hour technical structure identifies $0.3450 as another potential support level, followed by $0.3154.
These levels provide a framework for evaluating the current price action without assuming that any particular breakout will occur.
What Would a Larger Worldcoin Price Recovery Require?
A move toward WLD’s previous highs would require considerably more than a short-term technical rebound.
The token would need to establish a sequence of higher highs and higher lows while maintaining demand despite ongoing token releases. A sustained move above the $0.45 area, followed by a recovery toward $0.70, would provide evidence that buyers are capable of absorbing higher prices.
Beyond that level, the distance to the March 2024 peak remains substantial. Worldcoin would need to appreciate by several thousand percent from current prices to revisit that record.
The project’s longer-term trajectory will also depend on adoption of the World network, circulating supply, token distribution, and broader crypto-market liquidity. Technical indicators can describe the current market structure, but they cannot independently establish whether a multi-year recovery will occur.
For now, WLD remains in a high-volatility phase. The token has recovered significantly from its 2026 lows, while the $0.40-$0.45 region continues to determine whether the latest rebound develops into a broader trend change or remains another short-term recovery within a much larger downtrend.

Jack Spencer is a financial journalist and crypto market analyst covering digital assets, blockchain innovation, and global market developments. His reporting focuses on cryptocurrency price trends, regulation, institutional adoption, and the evolving digital asset ecosystem.
View all stories by Jack Spancer →