 BTC
 ETH
 USDT
 BNB
 XRP
 USDC
 SOL
 TRX
 FIGR_HELOC
 ZEC
 HYPE
 DOGE
 XMR
 USDS

Litecoin (LTC) Price Prediction: LTC Holds 65–67 Support as Wave G Signals Upside Toward $85
Litecoin (LTC) is consolidating around $70 after a strong September advance, with traders watching the $65–$67 region as key support.


A technical analysis based on a large symmetrical pattern identifies the current move as a potential Wave G, with an upside reference near $85 if the structure develops as projected.
The analysis identifies the $65–$67 area as a key monthly support band. Wall_Street_Levels described the zone as an “institutional interest level” and argued that holding it could open a path toward the $85 region. However, that interpretation remains dependent on price action and should not be treated as a guaranteed outcome.
The Litecoin price holds near $70.
LTC has maintained its position above the mid-$60s despite a modest pullback from its recent high. CoinMarketCap data showed Litecoin around $69.58 against USDT on October 6, with the cryptocurrency down roughly 0.7% over the previous 24 hours. At the same time, LTC remained about 27% higher over the preceding 30 days, highlighting the strength of the recent recovery.
TradingView’s Binance LTCUSDT page likewise showed a sharp improvement over the one month, while the broader performance picture remained mixed. The pair was still lower on a year-to-date and one-year basis despite the recent rally.
This distinction is important for any LTC price prediction. A strong monthly recovery does not necessarily mean that a longer-term downtrend has been fully reversed.
The immediate technical question is therefore whether Litecoin can continue holding above the $65–$67 area while buyers attempt to push the market through nearby resistance.
Wave G becomes the focus.
The supplied chart analysis identifies a large symmetrical formation on Litecoin and suggests that the market is currently progressing through Wave G.
Under this interpretation, Wave G is viewed as the advancing portion of the structure. The analysis expects its potential completion inside a designated resistance or supply area. If that scenario develops, the next phase would be labeled Wave H and could represent a corrective move.

Litecoin appears to be in bullish Wave G, with a potential Wave H correction ahead. Source: behdark/TrdingView
These wave labels are part of a technical-analysis framework rather than independently verifiable events. Their usefulness depends on how consistently price follows the proposed structure.
The more observable factor is the location of support and resistance. If LTC continues to hold above the mid-$60s, the bullish interpretation gains technical support. Conversely, a sustained breakdown through that area would weaken the setup.
$65–$67 support remains important.
Wall_Street_Levels placed particular emphasis on the $65–$67 range, describing it as monthly support and suggesting that a successful defense could put the $85 area back into focus.
The same analysis identified a secondary support area around $60–$63. It also placed a technical invalidation level below approximately $57.20. These levels are useful for understanding the structure, but they should be viewed as chart-based reference points rather than predetermined outcomes.
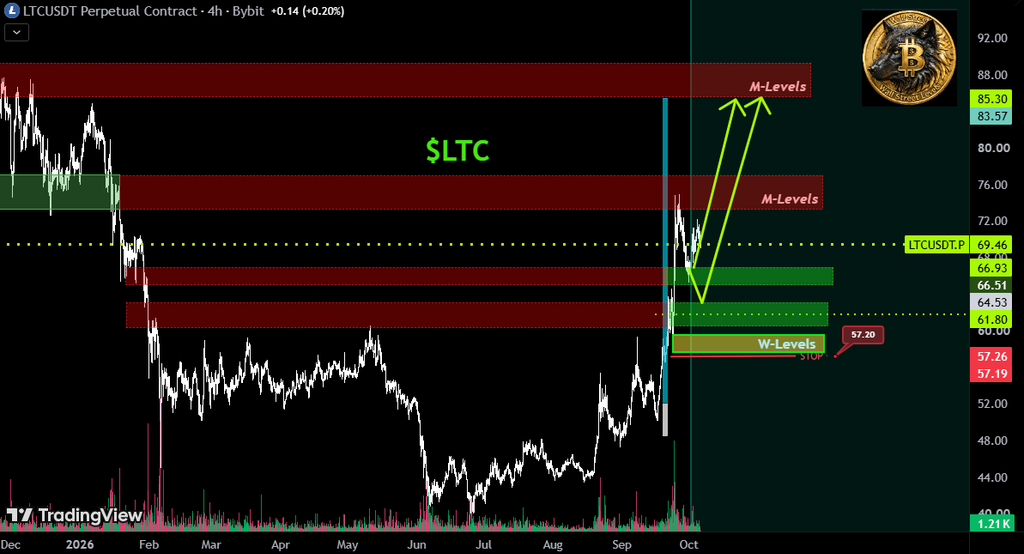
Litecoin is holding the 65–67 support zone, with $85 as the next potential upside interest area if support holds. Source: Wall_Street_Levels/TradingView
The broader Litecoin price analysis also shows why the $65–$67 region matters. Litecoin recently advanced from roughly $39 to almost $75 before entering a period of consolidation. TradingView’s recent LTCUSDT data shows the cryptocurrency remains substantially higher over the past month, even as shorter-term performance has cooled.
A move back toward $60–$63 would therefore represent a deeper retracement of the recent rally, while a sustained recovery above the recent highs would strengthen the continuation argument.
$85 becomes the next upside reference.
The $85 level is the main upside reference in the Wave G interpretation. From a price near $70, reaching $85 would require an advance of roughly 21%.
That makes $85 a technical target rather than a confirmed Litecoin forecast. For the level to become more credible, LTC would first need to establish support above the $65–$67 region and overcome resistance created by the recent trading range.
TradingView’s current LTCUSDT page shows a recent price around the low-$70s and a substantial monthly gain, but it also records weaker performance over longer periods. This mixed-timeframe picture argues for caution when interpreting the projected move.
In practical terms, the market would need to demonstrate continued demand rather than simply touch a higher price level.
Technical signals remain mixed.
TradingView’s LTCUSDT overview currently describes the technical summary as Neutral, with both oscillators and moving averages shown as Neutral on the accessed page.
That differs from the stronger bullish interpretation in the supplied chart analysis. The discrepancy illustrates an important point about LTC predictions: technical conclusions can change substantially depending on the indicator set, exchange, timeframe, and methodology used.
Momentum indicators can also become less reliable after a rapid rally. A market may remain structurally constructive while still experiencing a short-term pullback. For Litecoin, maintaining the higher support structure would therefore be more significant than any single oscillator reading.
The Litecoin ETF adds a broader market factor.
The Litecoin market also has a regulated exchange-traded product to consider. Canary Capital’s LTCC trades on Nasdaq and is designed to provide exposure to the price of Litecoin held by the trust. Canary reported net assets of approximately $14.66 million as of October 2, 2026.
SEC filings also document the Canary Litecoin ETF, while a September 2026 Grayscale filing described plans to rename the Grayscale Litecoin Trust as the Grayscale Litecoin Trust ETF in connection with its NYSE Arca listing process.
The presence of these products gives investors another channel for obtaining market exposure to LTC, but ETF developments do not by themselves establish a price target. Their influence on Litecoin’s market structure depends on factors such as demand, liquidity, and broader crypto-market conditions.
Litecoin’s supply cycle remains relevant.
Litecoin’s longer-term market structure is also influenced by its programmed supply schedule. The Litecoin network currently awards miners 6.25 LTC per block, with the reward designed to halve approximately every 840,000 blocks. The network is ultimately capped at 84 million LTC.
The next Litecoin halving is therefore another longer-term factor that market participants may monitor. However, historical halving cycles should not be treated as a mechanical forecasting tool because price also responds to broader liquidity, investor demand, and cryptocurrency market conditions.
What comes next for LTC?
The $65–$67 zone is likely to remain an important technical reference while Litecoin trades around $70. Holding above that area would preserve the bullish structure described in the Wave G analysis, while a break lower would increase the possibility of a retracement toward the $60–$63 region.
On the upside, traders will need to watch the recent high and subsequent resistance areas before treating $85 as a realistic continuation target. A sustained breakout would provide stronger evidence for the bullish scenario than a brief intraday move.

Litecoin (LTC) price chart. Source: ChainTelegram
The Wave H projection introduces another possibility: if Wave G reaches its proposed supply zone, the market could enter a corrective phase rather than continue rising immediately. That makes the path toward $85 conditional rather than certain.
For now, the LTC price prediction is best framed around these clearly defined levels. Litecoin is showing a substantial monthly recovery, but its broader trend remains mixed. The $65–$67 support zone, the recent highs, and the behavior around resistance should provide more useful evidence for the next phase of the market than any single projected target.

Riva A. Nahar joins our team as a Crypto Journalist, covering cryptocurrency markets, blockchain developments, DeFi, and emerging trends across the digital-asset industry. With a focus on clear, accurate, and well-researched reporting, Riva brings a balanced perspective to fast-moving crypto news and market developments. Her work aims to make complex industry developments accessible while maintaining strong journalistic standards.
View all stories by Riva A. Nahar →