 BTC
 ETH
 USDT
 BNB
 XRP
 USDC
 SOL
 TRX
 FIGR_HELOC
 ZEC
 HYPE
 DOGE
 XMR
 USDS

XRP Price Prediction: Can Bulls Reclaim $1.45 Before Targeting $2 and $3?
XRP is trading at a pivotal technical level, with chart analysts watching whether buyers can regain control of resistance near $1.45 and establish a path toward $2.


An extended recovery could bring $3 into focus, but the XRP price must first overcome several obstacles.
Recent technical assessments offer competing scenarios for the cryptocurrency. Elliott Wave analysis points to a possible end to the ongoing correction, while shorter-term indicators suggest selling pressure remains in place. The next decisive move around key support and resistance zones could help determine which outlook gains traction.
$1.45 Becomes the First Major Test for XRP Buyers
Short-term momentum presents a challenge to the broader recovery thesis. In a separate four-hour chart analysis, a TradingView contributor/analyst identified a resistance cluster around $1.4450–$1.4510, where an earlier bearish break of structure converges with the 55-period exponential moving average.
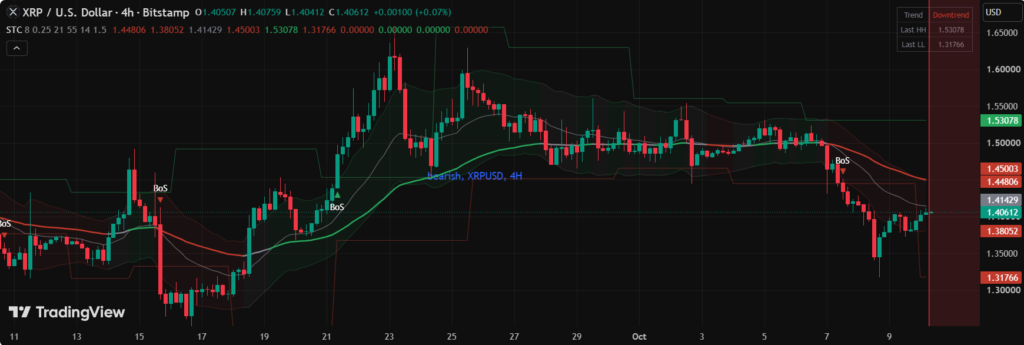
The analysis recorded XRP near $1.4072, below the 21-period EMA at $1.4153 and the 55-period EMA at $1.4508. Trading beneath both averages indicated that the immediate trend remained under pressure at the time of the assessment.
A rebound toward $1.45 could test whether sellers continue to defend the area. A rejection within the resistance band would support the possibility of another decline, while a decisive four-hour close above $1.4510 would weaken the bearish interpretation.
The downside levels identified in the same analysis include $1.3812 and the recent swing low at $1.3189. If selling intensifies beyond those areas, $1.2468 represents a deeper downside reference point.
These levels are particularly relevant because they distinguish an ordinary rebound from a potential change in market structure. A brief move above resistance may not be sufficient; sustained trading above the zone would provide stronger evidence that buyers are gaining control.
Elliott Wave Analysis Identifies Key Levels
A technical assessment published by Carolina (@Carolinatcwnl) on October 8, 2026, suggests XRP may be approaching the final stage of an ABC corrective pattern. In Elliott Wave analysis, this structure represents a three-part countertrend move that can precede a renewed advance, although the interpretation remains dependent on subsequent price action.
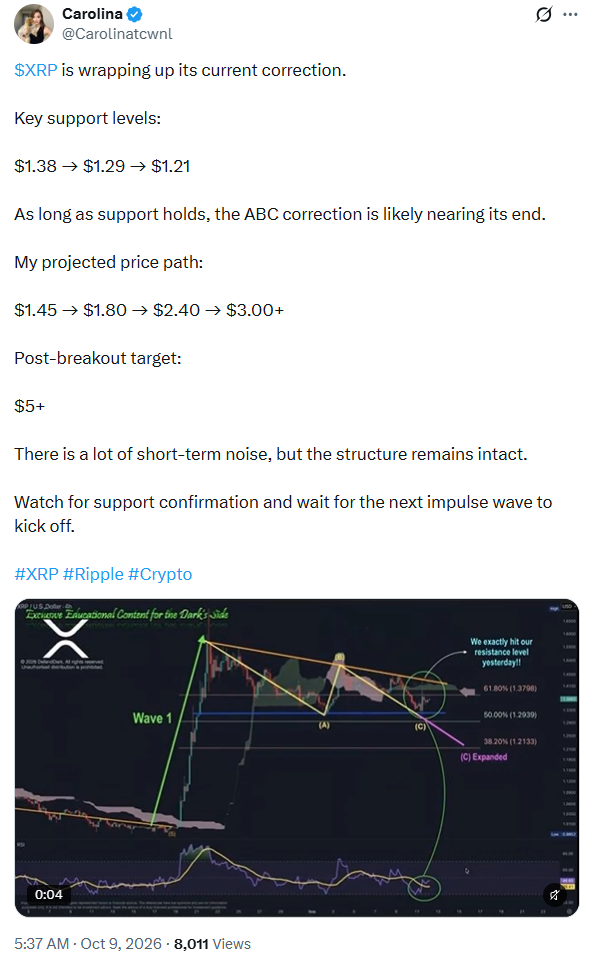
The chart identifies $1.38 as an initial support level, with additional downside protection around $1.29 and $1.21. These zones could become important if XRP attempts to establish a base before moving higher.
The analyst’s projected recovery path includes $1.45 and $1.80, followed by $2.40 and $3. The chart also outlines a longer-term possibility above $5, but such an outcome would require a much more substantial advance than the current setup has confirmed.
XRP was trading in the approximate $1.35–$1.41 range when the analysis appeared, following a recent decline toward $1.31. This price action highlights the importance of the lower support zones, where buyers would need to demonstrate sufficient demand to prevent a deeper correction.
The proposed Elliott Wave structure therefore offers a conditional bullish scenario rather than confirmation that a sustained rally has begun. A breakdown through successive supports would require the wave count and its associated targets to be reassessed.
Repeated Trendline Tests Put the $2 Target in Focus
A separate chart shared by Isabelle (@Isabelle_Seven) examines XRP’s interaction with descending resistance trendlines on the four-hour timeframe. The analysis highlights three downward-sloping trendlines, noting that the previous two were followed by sharp upward moves after price found support along an ascending trendline.
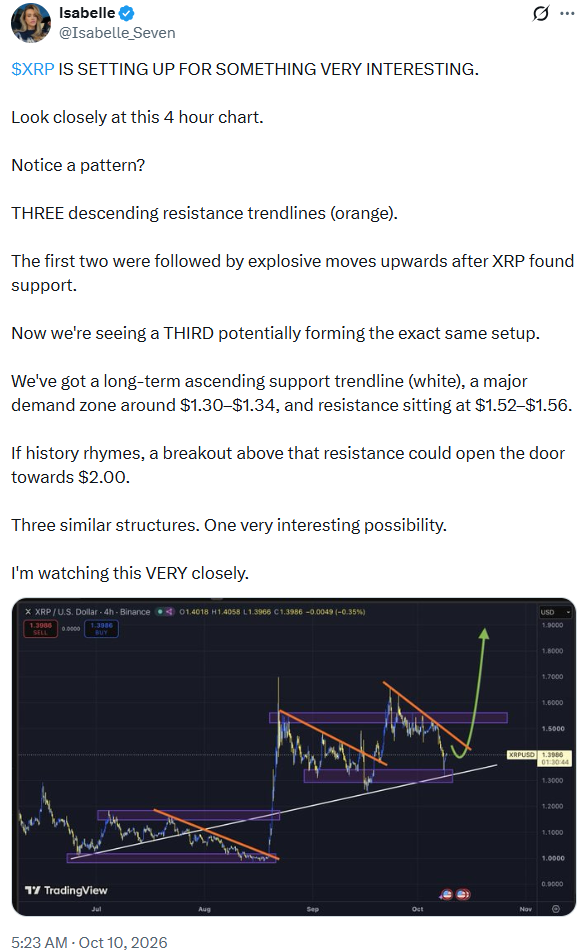
The chart places the main demand zone between $1.30 and $1.34. This range overlaps with the recent price lows and sits close to the support levels identified in the other technical assessments.
If XRP maintains this zone and breaks above the current descending resistance structure, traders could begin watching the $1.52–$1.56 region. A sustained move beyond that resistance would strengthen the case for an advance toward $2.
However, previous price reactions do not guarantee that the same pattern will repeat. Trendline breaks can fail, particularly when the broader market remains weak or buying volume is insufficient to support the move.
A sustained decline below $1.30 would also weaken this setup by indicating that the identified demand zone has failed to provide adequate support. In that case, the lower levels around $1.29 and $1.21 would become more relevant to the bearish scenario.
Three Price Zones That Could Shape XRP’s Next Move
The supplied chart analyses identify three areas that could help clarify XRP’s direction over the coming sessions.
First, the $1.30–$1.38 support region: This area could help determine whether the latest correction is stabilizing. Buyers would need to defend the zone to maintain the current bullish interpretation. A sustained breakdown would increase the risk of further losses toward $1.29 and $1.21.
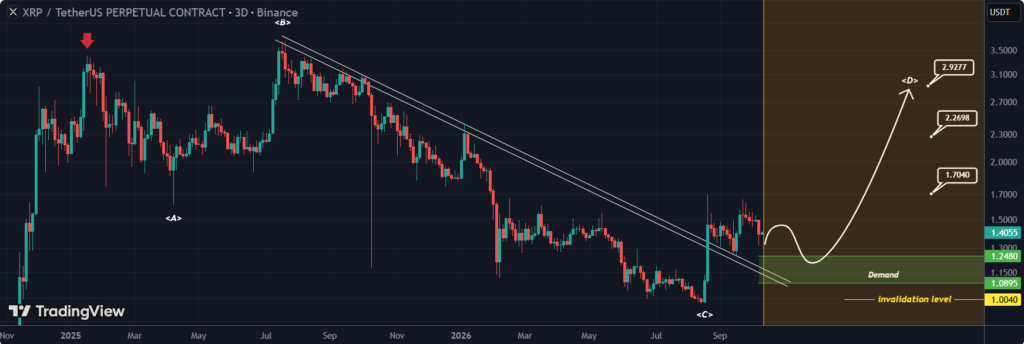
Second, resistance between $1.4450 and $1.4510: Reclaiming this range would mark an initial improvement in the short-term structure. Failure to break through it could leave XRP vulnerable to another test of nearby support.
Third, the $1.52–$1.56 resistance band: This zone represents a more demanding test for a potential recovery. A sustained breakout could improve the outlook for a move toward $1.80 and subsequently $2, although neither target would be assured.
If the market clears these obstacles, the Elliott Wave projection places $2.40 and $3 among the next potential upside levels. Those targets remain dependent on continued buying pressure and successful consolidation above reclaimed resistance.
The distinction between these levels matters. A move through the first resistance band would signal an improvement, while a break above the second would provide stronger evidence that the recovery has developed beyond a short-lived bounce.
XRP Forecast: A Rally Remains Conditional on Confirmation
XRP’s outlook combines a potentially constructive higher-timeframe structure with a weaker short-term trend. The Elliott Wave assessment anticipates a possible transition out of corrective price action, but the four-hour analysis shows that sellers retain an important defensive position near $1.45.
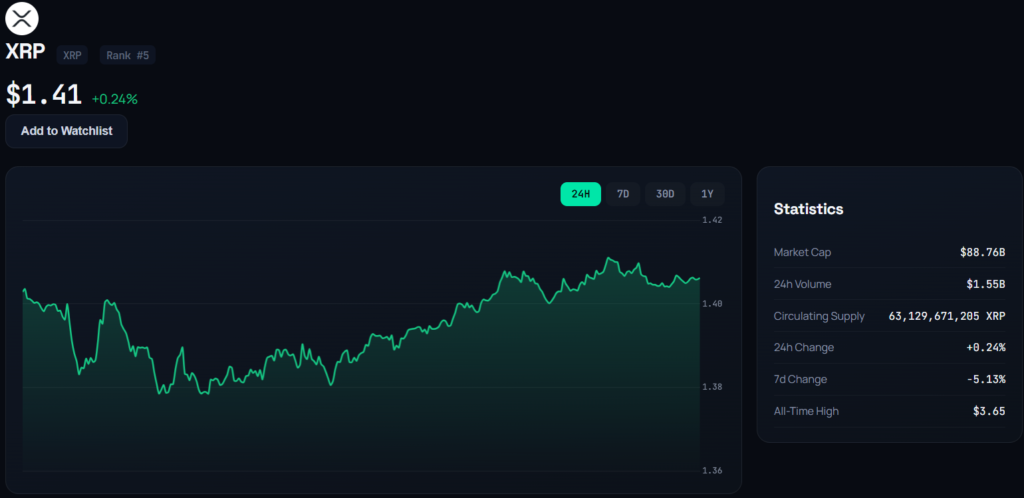
For a bullish scenario to gain credibility, XRP would need to preserve support, reclaim the $1.45 area, and move through the $1.52–$1.56 resistance band. These developments could establish a technical basis for testing $1.80 and $2, with $3 remaining a more distant projection.
The alternative scenario involves another rejection near resistance followed by a decline toward $1.38 or the $1.32 region. A break below the principal demand zone would increase the likelihood of tests near $1.29 and $1.21, potentially undermining the current Elliott Wave interpretation.
For market participants, the key question is whether XRP can convert its recent stabilization into a confirmed change in trend. The projected upside targets offer reference points, but the market’s response to support, resistance, and sustained buying pressure will provide more reliable evidence of its next direction.

Jack Spencer is a financial journalist and crypto market analyst covering digital assets, blockchain innovation, and global market developments. His reporting focuses on cryptocurrency price trends, regulation, institutional adoption, and the evolving digital asset ecosystem.
View all stories by Jack Spancer →