 BTC
 ETH
 USDT
 BNB
 USDC
 XRP
 SOL
 TRX
 FIGR_HELOC
 ZEC
 HYPE
 XMR
 DOGE
 USDS

Sui Price Prediction: SUI at a Technical Crossroads Between $0.55 Risk and a Potential $0.84 Rebound
SUI is approaching a critical technical zone near $0.70, with traders watching whether the token can hold support or resume its broader decline toward the $0.55 area.


The latest setup presents two competing scenarios. A TD Sequential buy signal has emerged on the 12-hour chart near $0.71, while broader moving-average readings remain bearish. For the SUI price prediction, the key question is whether this short-term reversal signal can develop into a sustained recovery toward $0.84 or fail and expose lower support.
SUI Price Prediction: TD Sequential Signals Potential Rebound
Ali Charts highlighted a TD Sequential 9 buy signal on SUI’s 12-hour chart at approximately $0.718. According to the analyst, an earlier signal from the indicator preceded a 17% rally and correctly identified a subsequent shift in momentum.
The current signal appeared after SUI declined from the $0.83 area toward recent lows. That places the indicator close to an important support region rather than in the middle of an established uptrend.
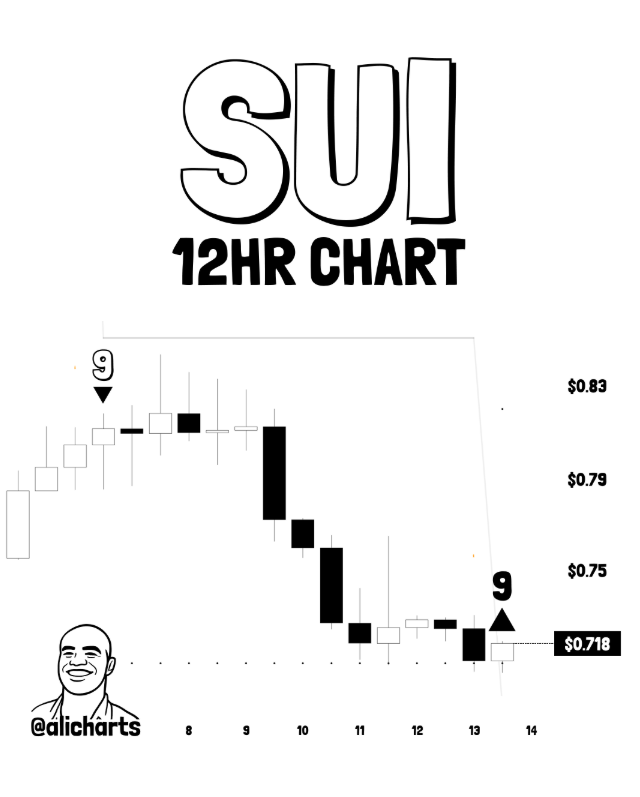
A TD sequential signal, however, does not confirm a trend reversal by itself. It identifies potential exhaustion in the prevailing move. Price action, volume, and follow-through therefore remain important before treating the signal as evidence of a durable recovery.
SUI was trading around $0.70-$0.72 in the latest observations. CoinGecko’s recent data showed a 24-hour range of roughly $0.71-$0.76 and a seven-day range extending toward $0.84, illustrating the token’s elevated volatility.
SUI Chart Faces Resistance Near $0.84
The $0.84 region is becoming an important level in the current SUI chart structure.
One of the cited technical setups places SUI inside a bearish channel on the 1-hour timeframe. The lower boundary of that channel has recently come under pressure, while the upper portion of the structure points toward the $0.84 area.
A recovery toward $0.84 would therefore represent a meaningful move from current levels rather than a minor technical bounce. At approximately $0.71, a move to $0.84 would amount to an advance of about 18%.
The level also has historical significance within the recent trading range. CoinGecko data shows the token reached approximately $0.8436 during the latest seven-day period, suggesting that the $0.84 area is already an observable market reference rather than an arbitrary price target.
For the SUI token price prediction, sustained trading above nearby resistance would provide stronger evidence that buyers are regaining control. A rejection around $0.84, by contrast, would leave the broader bearish structure intact.
Moving Averages Keep the Broader Trend Bearish
While the TD Sequential reading offers a potential short-term bullish signal, TradingView’s technical summary presents a considerably more cautious picture.
Multiple simple and exponential moving averages, including the 10-, 20-, 30-, 50-, 100-, and 200-period averages, have generally remained above the current price. That configuration produces a concentration of resistance overhead and contributes to the broader sell bias.
The VWMA and Hull Moving Average also align with the weaker trend in the cited technical readings. The Ichimoku baseline adds to the resistance structure.
This distinction is important for any SUI crypto price prediction. A short-term reversal signal does not necessarily mean the larger trend has turned bullish. For that to happen, SUI would need to reclaim important moving averages and hold those levels as support.
RSI and Momentum Indicators Offer a Mixed Picture
Momentum indicators provide less decisive evidence than the moving averages.
RSI 14 readings cited around this period have generally been in the mid-30s to low-40s. That suggests weak momentum but does not, on its own, establish an immediate reversal. The reading is also below the conventional overbought threshold, meaning the market does not currently show the type of extreme upside momentum associated with a strong bullish trend.
Other oscillators, including the Stochastic, Commodity Channel Index, and Williams %R, have produced oversold readings in some technical snapshots. Meanwhile, MACD remains negative or relatively flat, indicating that bearish momentum has weakened at times but has not yet produced a convincing bullish crossover.
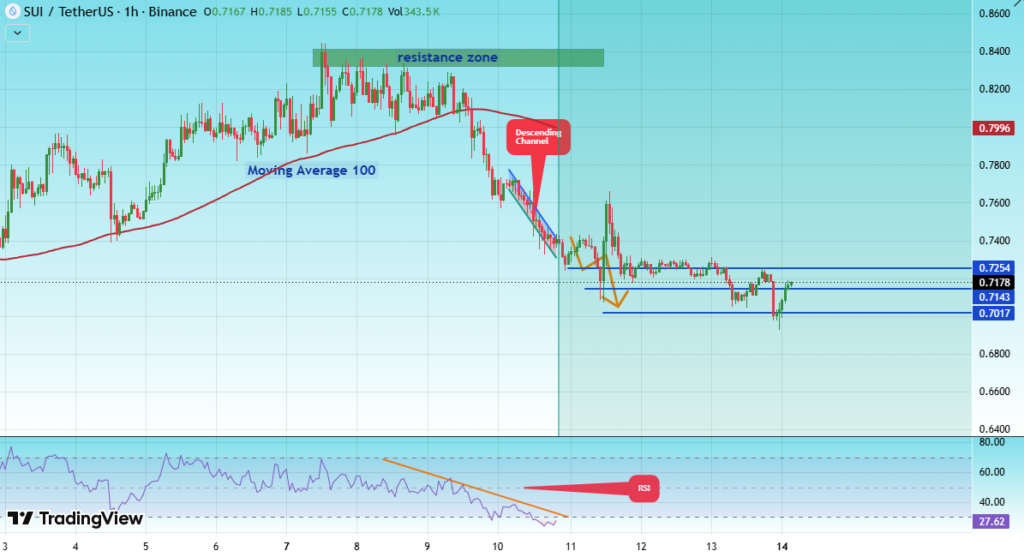
The Average Directional Index has been around the low-to-mid 20s in the cited readings. That points to moderate trend strength rather than an exceptionally powerful directional move.
Taken together, the indicators describe a market under pressure but approaching an area where a technical bounce is possible.
$0.7214 Becomes a Key Level for SUI
Another technical analysis of the weekly structure identifies $0.7214 as an important threshold.
The analysis argues that if SUI fails to remain above this level and falls back into its previous range, the downside could extend considerably. Under that scenario, the $0.55 area becomes a potential deeper support test.
The same analysis identifies a previous spring around $0.63 within a Wyckoff-style structure. SUI subsequently produced a strong bullish candle but was rejected near the weekly 20-period moving average.
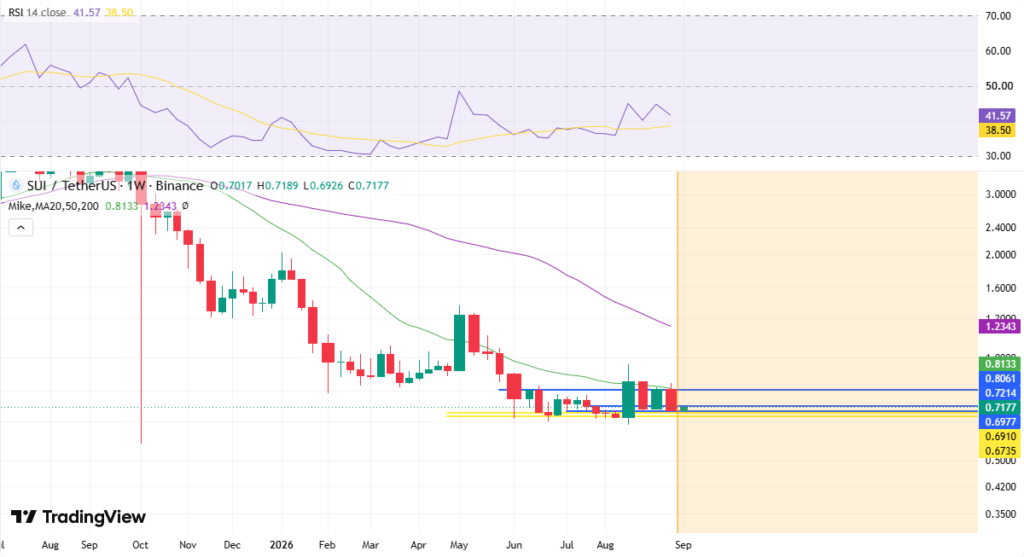
That rejection is significant because the weekly MA20 is currently sloping downward. A declining long-term moving average can act as resistance until price successfully reclaims it.
The more constructive scenario would therefore require SUI to regain the weekly MA20 and turn it into support. The cited analysis places that level around $0.81-$0.82.
$0.55 Risk Remains if Support Fails
The bearish case becomes more important if SUI loses the $0.70-$0.72 region decisively.
A sustained move below $0.7214 would weaken the argument that the recent decline represents only a temporary correction. It could instead indicate that SUI has failed to reclaim the upper portion of its previous range.
Under that structure, $0.63 becomes an intermediate area to monitor, while the $0.55 level represents the deeper downside scenario identified by the weekly analysis.
A move from roughly $0.71 to $0.55 would represent a decline of about 23%. That makes the $0.70-$0.72 zone particularly important for determining the near-term SUI coin price direction.
Importantly, $0.55 should be treated as a technical risk level rather than a forecast that the token will necessarily reach it.
SUI Token Unlocks Add a Supply Consideration
Technical analysis is only one part of the SUI market outlook. Token supply is another factor worth monitoring.
Sui’s official tokenomics documents state that the total SUI supply is capped at 10 billion tokens. Not all of those tokens entered circulation at mainnet launch; additional tokens are released according to the project’s distribution schedule.
Current market data indicates that roughly 4.1 billion SUI are circulating, while the remaining supply is subject to the project’s release schedule.
This makes each SUI token unlock relevant to market structure. Additional circulating supply can increase the amount of tokens available for trading, although the actual price effect depends on demand, recipient behavior, and broader market conditions.
Recent third-party tracking of the SUI token unlock schedule indicates that releases continue into the coming years, making supply expansion a factor investors and traders may continue to monitor.
What the SUI Price Prediction Shows
The current technical structure does not provide a straightforward bullish or bearish conclusion.
On the bullish side, the 12-hour TD Sequential 9 buy signal near $0.718, proximity to channel support, and the possibility of a move toward $0.84 support a short-term rebound scenario.
On the bearish side, SUI remains below several major moving averages, momentum indicators have not confirmed a sustained reversal, and the weekly MA20 continues to slope downward.
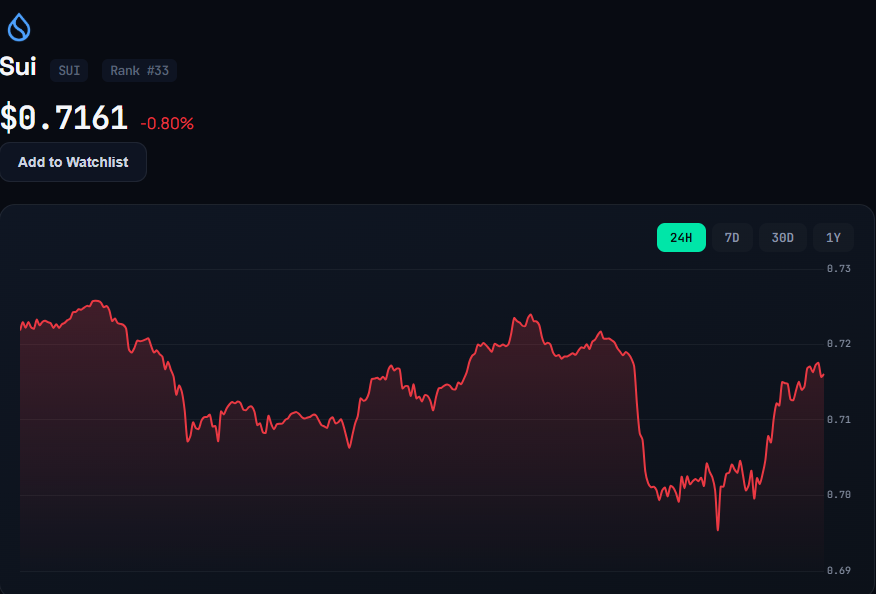
The immediate levels are therefore relatively clear. Holding the $0.70-$0.72 region would keep the rebound scenario alive, with $0.84 representing the next major upside reference. Reclaiming the $0.81-$0.82 weekly MA20 area would provide stronger evidence of a structural improvement.
Conversely, losing $0.7214 and subsequently breaking below the $0.63 region would weaken the recovery thesis and increase attention on the $0.55 downside level.
For now, SUI remains at a technical crossroads. The latest buy signal suggests that sellers may be losing some short-term momentum, but the broader trend has yet to establish a confirmed bullish reversal. Traders watching the SUI crypto market will likely focus on whether buyers can defend current support and eventually reclaim the weekly moving-average resistance before assigning greater weight to the $0.84 rebound scenario.
SUI is also still substantially below its historical peak. CoinGecko lists an all-time high of $5.35, recorded in January 2025, highlighting the scale of the longer-term decline and the distance the token would need to cover to fully reverse its previous downtrend.
As a result, the current setup is better characterized as a potential technical recovery attempt than a confirmed trend reversal. The next decisive price reaction around $0.70-$0.72 should provide a clearer indication of whether SUI is preparing for a rebound or another leg lower.

Riva A. Nahar joins our team as a Crypto Journalist, covering cryptocurrency markets, blockchain developments, DeFi, and emerging trends across the digital-asset industry. With a focus on clear, accurate, and well-researched reporting, Riva brings a balanced perspective to fast-moving crypto news and market developments. Her work aims to make complex industry developments accessible while maintaining strong journalistic standards.
View all stories by Riva A. Nahar →