 BTC
 ETH
 USDT
 BNB
 USDC
 XRP
 SOL
 TRX
 FIGR_HELOC
 ZEC
 HYPE
 XMR
 DOGE
 USDS

SUI Price Prediction: Can Bulls Turn the $0.70 Defense Into a Run Toward $0.85?
Sui is attempting to stabilize after losing ground through late August, with a sharp rebound from the $0.70-$0.72 region bringing the token back toward $0.77.

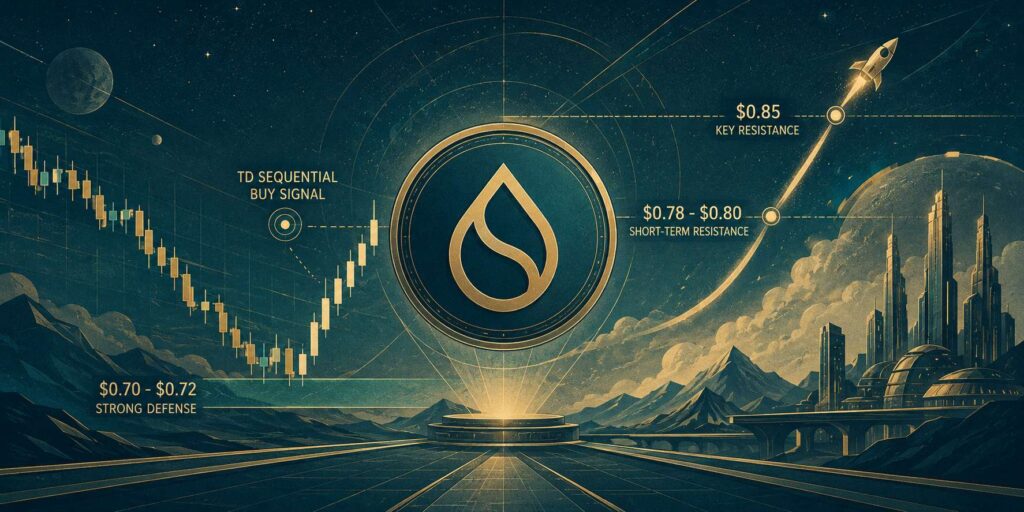
The SUI price recovery has put short-term resistance levels back in focus, while a TD Sequential buy setup on the daily chart has added another bullish signal to the technical picture.
SUI gained roughly 5%-6% over the 24 hours leading into September 3, recovering from its recent lows. However, the move remains relatively modest compared with the token’s broader decline, and several longer-term indicators continue to point to resistance overhead.
For bulls, the next challenge is clear: SUI needs to convert its recent bounce into a sustained breakout. The $0.78-$0.80 area represents the first major hurdle, while a move toward $0.85 would bring a more important long-term resistance level into play.
SUI Finds Buyers After Falling Toward $0.70
The recent price action began with a sustained decline from roughly $0.87 in late August. SUI eventually slipped toward the $0.70-$0.72 region, where buying interest helped slow the sell-off.
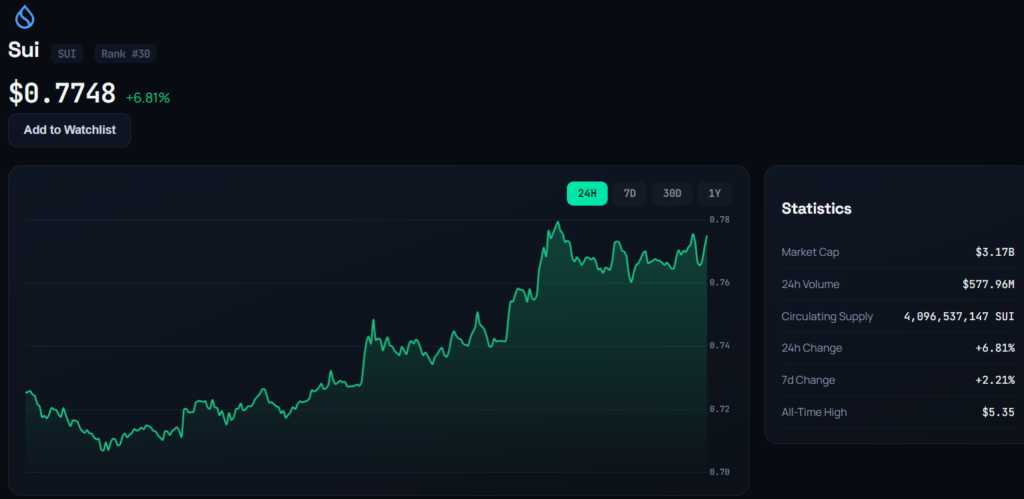
That recovery pushed the token back above several short-term moving averages. The 10-, 20-, 30-, and 50-period averages in the supplied technical data are concentrated around $0.72-$0.75, meaning the latest move has reclaimed several near-term levels that had previously acted as resistance.
The improvement is visible, but it does not yet amount to a confirmed reversal.
SUI remains below several longer-term indicators. The 100-day EMA is located around $0.78-$0.79, while the 200-day SMA sits near $0.85. These levels could make the recovery progressively more difficult if buying pressure fades.
A TD9 Reading Adds to the Rebound Case
One of the more notable developments is the appearance of a TD Sequential 9 buy signal on SUI’s daily chart.
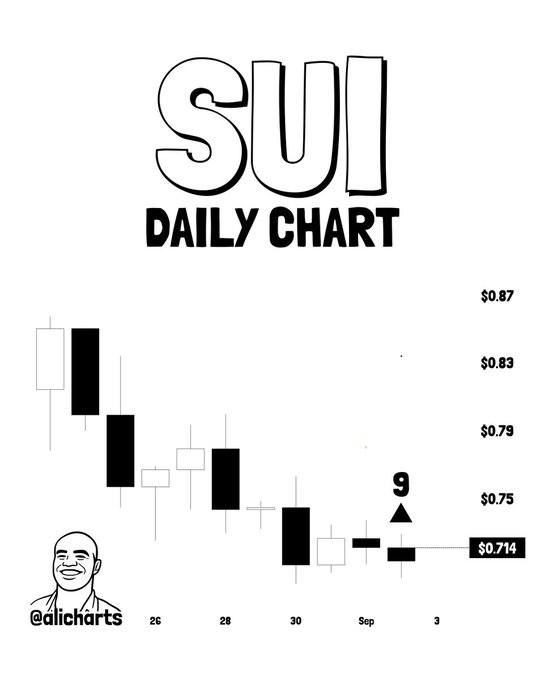
Crypto market analyst Ali Charts highlighted the setup after a sequence of bearish candles pushed SUI down from approximately $0.87 to $0.714. The TD Sequential indicator is designed to identify potential exhaustion in an established trend.
Ali Charts said the signal could precede a “1-4 daily candlestick rebound.”
That does not mean the indicator guarantees a sustained rally. TD Sequential readings can identify potential turning points, but confirmation generally comes from subsequent price action.
In SUI’s case, the timing is significant because the signal emerged close to an established support region. If buyers continue defending that area, the indicator could prove useful as an early indication that selling momentum is weakening.
$0.74 Breakout Could Change the Short-Term Structure
The most immediate technical trigger sits around $0.74.
A TradingView setup from Elite_Forex_Signals_pro shows SUI consolidating within a broader support region while approaching a descending trendline. The analysis identifies a sustained one-hour close above the trendline, around $0.74, as the condition that would strengthen the bullish setup.
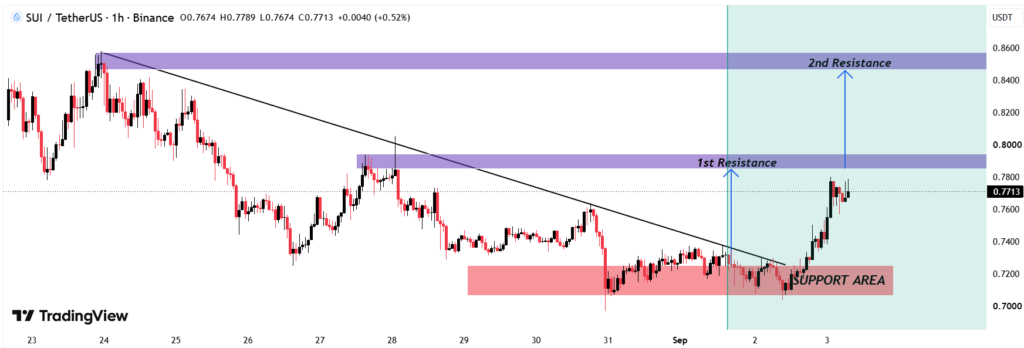
If that happens, the next resistance is positioned near $0.79.
This level is important because it sits close to the 100-day EMA and the upper end of the current short-term trading structure. A clean break could open the way toward $0.85, although buyers would still need to contend with additional resistance along the way.
The setup therefore depends less on the recent 6% gain itself and more on whether SUI can hold its recovery while breaking through these overhead barriers.
Momentum Has Improved, but Confirmation Is Missing
The broader indicator picture remains cautious.
SUI’s daily RSI is around 51.7, which places it close to the midpoint. The reading shows that momentum has recovered from weaker conditions but has not reached a level typically associated with strong bullish momentum.
The MACD is also not providing a decisive confirmation. The reported MACD level of approximately 0.007 remains below its signal line near 0.012, although the histogram has begun to flatten.
The ADX reading near 24 suggests that the prevailing trend lacks strong directional conviction. Meanwhile, Williams %R around -81 reflects the weakness seen during the recent decline and leaves room for a short-term recovery.
Taken together, these readings suggest that SUI is at an inflection point rather than already being in a confirmed uptrend.
$0.78-$0.80 Becomes the First Major Test
For the bulls, the next meaningful zone is between $0.78 and $0.80.
SUI needs to push through this region to demonstrate that the rebound has enough strength to challenge higher resistance. The area is reinforced by the 100-day EMA near $0.78-$0.79 and a cluster of recent price reactions.
A successful move above $0.80 would improve the short-term structure and bring $0.85 into focus.
The latter is particularly important because the 200-day SMA is positioned close to that level. A recovery above the 200-day average would represent a more meaningful shift in SUI’s technical structure than the current bounce above short-term averages.
Bears Still Have a Clear Invalidation Zone
The bullish setup remains dependent on SUI maintaining its recent support.
The $0.72-$0.73 region is the first area to watch on a pullback. Below that, $0.70-$0.71 becomes the more important defensive zone.
A decisive break beneath $0.70 would undermine the current recovery structure and could expose the $0.65-$0.67 region as the next area of interest.
This downside scenario is important because the recent rebound has not yet changed the broader trend. SUI’s longer-term moving averages remain bearish, and the supplied TradingView data continues to show a neutral-to-sell bias across broader timeframes.
What the SUI Price Prediction Looks Like Now
The current setup presents two competing signals.
On one side, SUI has rebounded approximately 5%-6% from its recent lows, recovered several short-term moving averages, and printed a TD Sequential 9 buy signal. Holding above $0.72-$0.75 could allow the recovery to continue.
On the other hand, the token still faces resistance around $0.78-$0.80, followed by the much more significant $0.85 area. Momentum indicators have not yet provided a strong confirmation of a trend reversal.
For that reason, $0.85 should be viewed as a technical resistance objective rather than a guaranteed destination. A sustained breakout above $0.74 could first send SUI toward $0.79-$0.80, while a subsequent move through that zone would make $0.85 the next major test.
The opposite scenario would become more relevant if SUI loses $0.70-$0.71. Such a move would indicate that sellers have regained control and could shift attention toward the lower $0.65-$0.67 support region.
Ultimately, SUI’s next major move will depend on whether buyers can turn the recent bounce into a confirmed breakout. The TD9 signal provides an encouraging technical backdrop, but price action around $0.78-$0.85 will be far more important in determining whether the recovery can develop into a broader reversal.

Jack Spencer is a financial journalist and crypto market analyst covering digital assets, blockchain innovation, and global market developments. His reporting focuses on cryptocurrency price trends, regulation, institutional adoption, and the evolving digital asset ecosystem.
View all stories by Jack Spancer →