 BTC
BTC  ETH
ETH  USDT
USDT  BNB
BNB  XRP
XRP  USDC
USDC  SOL
SOL  TRX
TRX  ZEC
ZEC  FIGR_HELOC
  HYPE
HYPE  DOGE
DOGE  XMR
XMR  WBT
WBT 
Sui Price Prediction: SUI Eyes $1.40-$1.60 as Bullish Wedge Signals 40%-50% Breakout Potential
SUI has entered a stronger technical phase after a sharp weekly recovery, with a bullish wedge structure and improving momentum putting the $1.40-$1.60 region on traders’ radar.


The recent move has significantly changed the short-term setup for the Sui token. SUI was trading around $1.04, with its weekly performance up roughly 44% and its monthly gain standing near 27% in the latest reading. However, the token remained more than 70% below its January 2025 all-time high of $5.3687, suggesting the recent rally is part of a broader recovery rather than a return to its previous peak levels.
SUI Price Prediction: Bullish Wedge Points to a Potential Breakout
The latest SUI chart shows price consolidating within a narrowing structure after an extended period of weakness. These formations can develop when selling pressure gradually weakens while buyers begin absorbing supply.
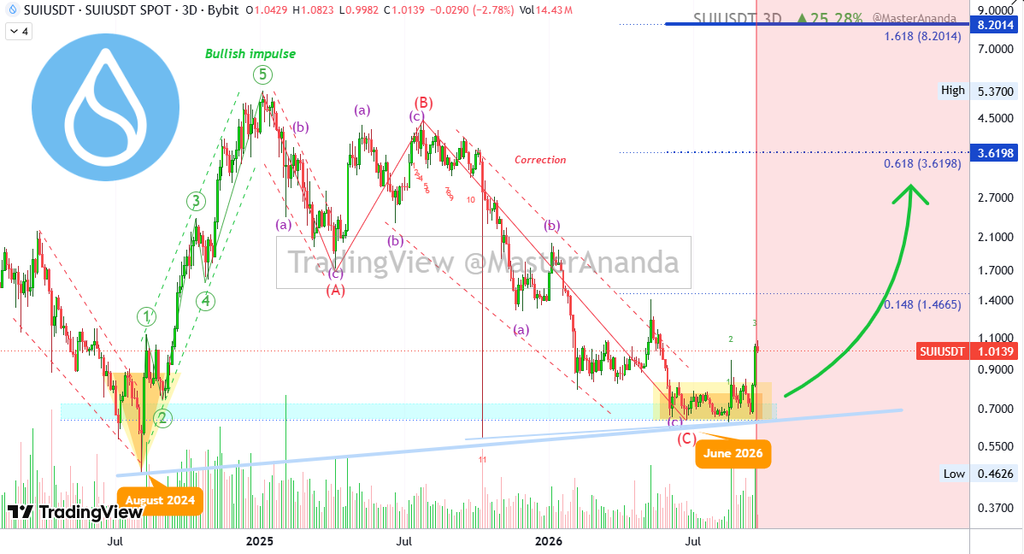
A breakout from the upper boundary would provide a clearer technical confirmation. The chart-based scenario cited in the source material projects a potential move of approximately 40%-50% from the breakout area. If calculated from a price near $1.04, a 40%-50% advance would place the theoretical range around $1.46-$1.56, broadly overlapping the $1.40-$1.60 zone highlighted in this Sui crypto price prediction.
That projection should be treated as a technical scenario rather than a confirmed price target. A wedge alone does not guarantee a breakout, and the validity of the setup would depend on how price behaves at resistance and whether trading activity expands alongside the move.
TradingView Signals Show Stronger Short-Term Momentum
The platform’s current reading identifies a buy signal for SUI, while the one-week rating also shows a buy signal. At the same time, the one-month rating remains a sell. This difference is important because it shows that the recent momentum has improved substantially without completely reversing the longer-term trend.
Moving averages are contributing significantly to the current bullish reading. The broader technical summary indicates that moving averages are tilted toward buy conditions, suggesting that price has moved above a substantial portion of its shorter- and medium-term trend references.
The oscillator section is less conclusive in the available TradingView extract. Individual readings for indicators such as the 14-period RSI, MACD, and Stochastic RSI are not fully populated in the static data, so assigning an exact current value to each indicator would not be reliable.
That distinction matters for a data-driven Sui coin price prediction. A platform-wide technical rating should not be presented as though every individual indicator has independently confirmed the same signal.
$1.00 Becomes an Important Technical Area
With SUI recently trading above that psychological threshold, the area could become an important reference point if the market experiences a pullback. Holding above it would preserve the recent higher-price structure, while a decisive loss of the level could weaken the immediate bullish setup.

TradingView’s latest data shows a daily range around $1.03-$1.08 in one recent snapshot, illustrating the elevated volatility surrounding the current move. The same data shows the price still substantially below its January 2025 peak, reinforcing the distinction between a short-term recovery and a confirmed long-term reversal.
For traders studying the SUI chart, the reaction around $1.00 and the eventual test of the wedge’s upper boundary may therefore be more informative than the percentage projection alone.
$1.40-$1.60 Is the Key Upside Scenario
The $1.40-$1.60 area represents the principal upside zone in the bullish scenario described by the source analysis.
From approximately $1.04, reaching $1.40 would require a gain of about 35%, while $1.60 would represent an advance of roughly 54%. The original 40%-50% breakout estimate therefore places the middle of the projected range close to the $1.45-$1.55 area.

For that scenario to gain technical credibility, the price would need to break above the relevant wedge resistance and maintain the breakout rather than producing a brief move followed by a rejection. Increasing volume during the breakout would generally provide stronger confirmation than a price move occurring on declining activity.
A failed breakout would present a different picture. If the price loses the breakout structure and falls back toward established support, the bullish wedge thesis would become less convincing.
Sui Ecosystem Fundamentals Remain Relevant
Sui’s infrastructure continues to expand across decentralized finance, payments, and developer tooling. The Sui Foundation says DeepBook provides an on-chain central limit order book, while gasless stablecoin transfers are live across multiple stablecoins. Sui has also described Hashi as infrastructure being developed to provide Bitcoin-related financial functionality without requiring BTC to leave the Bitcoin network.
The network’s recent development activity gives investors and analysts additional fundamental variables to monitor alongside the SUI price. Adoption, transaction activity, liquidity, applications, and developer usage can influence how the ecosystem evolves, although none of these factors provides a reliable short-term price forecast by itself.
This is particularly relevant when considering a longer-term Sui token price prediction. Strong ecosystem development can support network utility, but the market value of SUI remains influenced by broader crypto-market conditions, liquidity, token supply dynamics, and investor sentiment.
SUI Token Unlocks Could Add Volatility
SUI follows a scheduled token-release structure, meaning additional tokens can enter circulation over time. Earlier September reporting highlighted an approximately 13.53 million token release, representing around 0.33% of released supply at that point. The distribution involved early contributors, the community reserve, and the Mysten Labs treasury.
Token unlocks do not automatically result in selling pressure. Their market impact depends on how recipients use the released tokens, prevailing liquidity, and overall demand. Nevertheless, scheduled supply increases are worth monitoring because they can influence market dynamics during periods of elevated volatility.
What the SUI Price Prediction Depends On
The bullish case for SUI currently rests on several technical conditions rather than one isolated indicator.
First, the price needs to sustain its recent recovery. Second, the wedge resistance needs to break convincingly. Third, trading volume should ideally support the move. Finally, the token needs to maintain important reclaimed support areas if the market undergoes a correction.
The current TradingView picture supports a stronger short-term trend, but the one-month sell rating and SUI’s large distance from its previous all-time high show why the broader trend still requires caution.
Under the bullish technical scenario, a sustained breakout could place $1.40-$1.60 within reach of the projected move. Without confirmation, however, the 40%-50% figure remains a chart-based possibility rather than an established outcome.
