 BTC
BTC  ETH
ETH  USDT
USDT  BNB
BNB  XRP
XRP  USDC
USDC  SOL
SOL  TRX
TRX  ZEC
ZEC  FIGR_HELOC
  HYPE
HYPE  DOGE
DOGE  XMR
XMR  WBT
WBT 
Worldcoin (WLD) Price Prediction: Recovery Gains Traction but $0.42 Breakout Holds the Key
Worldcoin (WLD) is showing signs of a technical recovery after spending much of the past several years under heavy selling pressure.

The recent WLD price improvement, however, has not yet transformed the broader market structure into a confirmed bullish trend.
WLD is trading near $0.40 after advancing more than 12% over the past week. The most notable development is the emergence of bullish SuperTrend signals on both the daily and weekly charts, suggesting that selling pressure may be easing across multiple timeframes.
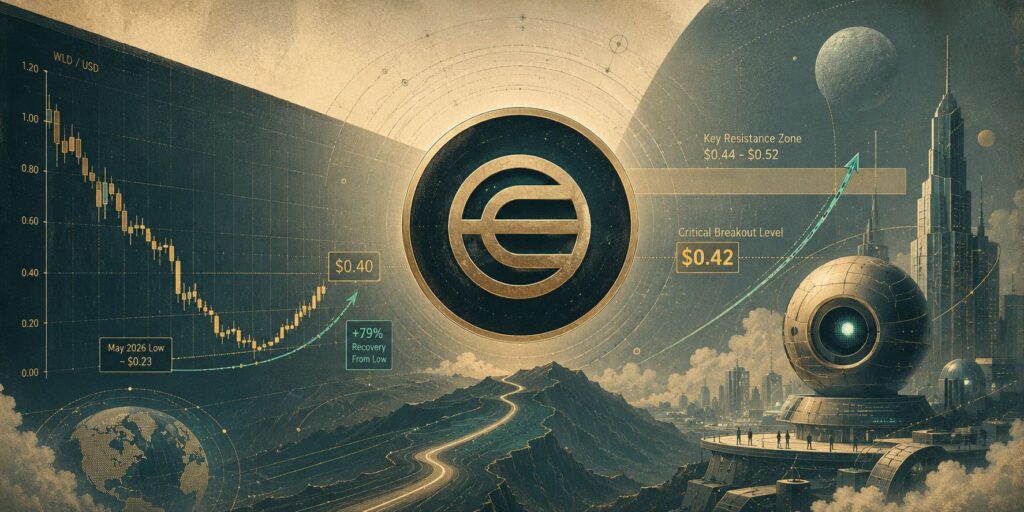
The recovery represents a substantial rebound from the token’s May 2026 low near $0.23. Crypto trader @0xSupremo_ estimates that Worldcoin has climbed roughly 79% from that bottom. The daily chart is also beginning to produce higher lows, while SuperTrend support has moved toward the $0.33 region.
Still, the broader picture remains mixed. The Worldcoin price has fallen dramatically from its historical peak above $11, meaning the latest advance needs considerably more confirmation before it can be classified as a major trend reversal.
The central question for the current Worldcoin price outlook is whether buyers can push the token beyond the $0.42 area and eventually challenge the wider $0.44-$0.52 resistance region.
Recovery Has Improved the Market Structure
The latest rally has changed WLD’s short-term technical profile considerably. Instead of continuing to print lower lows, the token has established a series of higher lows on the daily chart and recovered above several important technical averages.

This improvement is particularly notable because the token spent an extended period in a persistent downtrend. A transition from lower lows to higher lows can represent the first stage of a structural change, although a genuine reversal generally requires the market to follow through with higher highs as well.
The $0.40 region has consequently become an important psychological area. Holding above it would allow bulls to maintain control of the latest recovery, while repeated rejection could indicate that sellers remain active near the upper end of the current range.
The broader resistance zone begins around $0.42 and stretches toward $0.52. WLD must clear multiple barriers inside this range before the current rebound can develop into a sustained medium-term advance.
Short-Term Indicators Point to Strong Buying Pressure
Momentum indicators are considerably more constructive on shorter timeframes.
A 30-minute technical scan shared by Olivier Langlois placed WLD at approximately $0.4116, around 4.57% above its 24-hour volume-weighted average price. The same analysis recorded an RSI reading of 82 and an ADX of 32, accompanied by strong trading volume on Kraken.
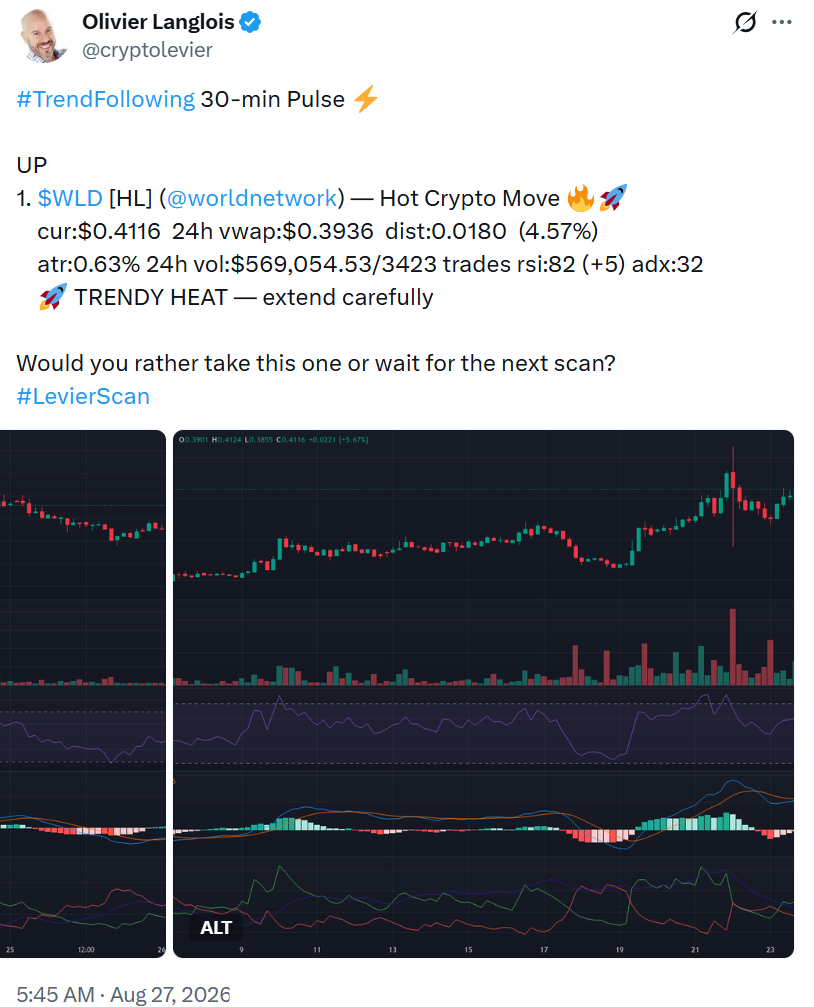
The combination points to powerful short-term buying pressure. RSI above 70, however, also indicates that the market had become overbought on the 30-minute chart.
Additional signals were aligned with the bullish move. MACD crossovers were positive, directional movement indicators were improving, and bullish conditions were visible across the 15-minute, 30-minute, one-hour, and four-hour charts.
That combination can support further upside, but it also raises the possibility of a temporary cooling period. When short-term RSI becomes heavily extended, Worldcoin price could consolidate or retrace before buyers make another attempt at overhead resistance.
Weekly Chart Offers the Bigger Test
The bullish SuperTrend transition is arguably the most important technical development in the current setup.
@0xSupremo_ identified bullish SuperTrend flips on both the daily and weekly charts after WLD spent an extended period in a major downtrend. The daily chart is already showing a more constructive sequence of higher lows, with the SuperTrend indicator providing support near $0.33.
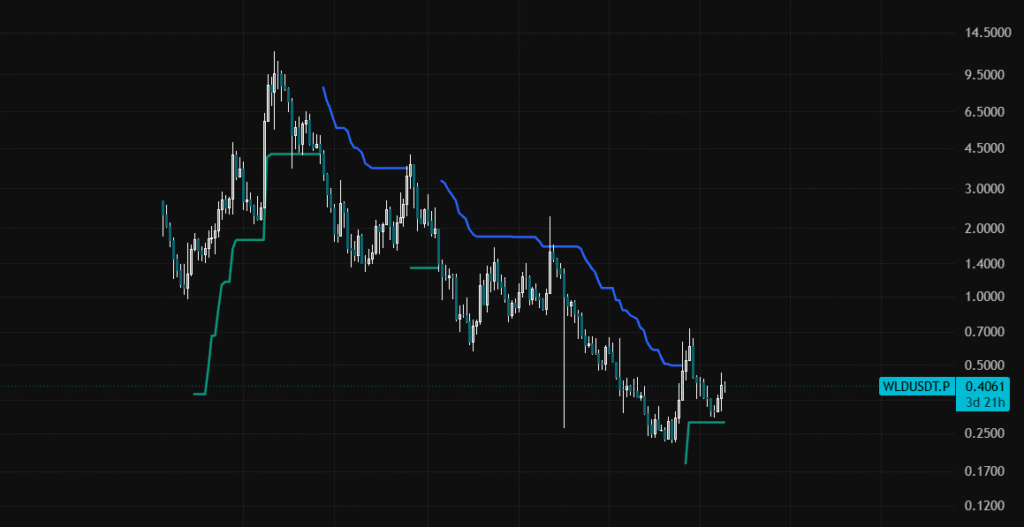
Still, the weekly signal deserves more caution. A bullish weekly SuperTrend flip can mark the early stages of stabilization, but it does not automatically mean that a multi-year bear market has ended. WLD still needs to establish a sequence of higher highs and defend newly created support levels to confirm that buyers have taken control over a longer horizon.
This makes the next several resistance tests particularly important. If the price can continue advancing while maintaining its higher-low structure, the weekly signal will gain credibility. Failure to follow through, by contrast, could leave the latest move classified as another recovery rally inside a larger downtrend.
The improving supply backdrop, including reduced token unlocks and the reported Grayscale ETF filing, may provide an additional fundamental catalyst. Nevertheless, price action remains the clearest confirmation that market sentiment is genuinely changing.
Moving-Average Cluster Could Define the Next Pullback
WLD’s relationship with its major moving averages provides another important reference for the current setup.
The 20-day, 50-day, and 200-day moving averages have recently converged around $0.36-$0.37. With the token trading close to $0.40, WLD remains above the entire cluster.
This is technically constructive because a group of closely positioned moving averages can act as a broad support zone during a developing recovery. If buyers continue defending this area during future pullbacks, the structure would remain relatively healthy.
The first downside references are located around $0.39 and $0.38. A deeper retracement could then bring $0.36-$0.37 into focus.
Losing the moving-average cluster would be more significant than simply falling below one of the nearby support levels because it would place Worldcoin back beneath several important trend measures simultaneously.
Daily RSI Leaves Room for Further Gains
The RSI picture becomes more balanced when viewed beyond the intraday chart.
Daily RSI readings have recently remained around 60-63. Bitget’s technical data showed an RSI(14) reading of 62.94, while another analysis placed the indicator near 60.
Both readings are comfortably above the neutral 50 threshold, suggesting that momentum currently favors buyers. At the same time, the daily RSI remains below 70, meaning the broader market has not reached the same degree of technical extension seen on the 30-minute chart.
This difference is important.
WLD can experience a short-term pullback without necessarily damaging its larger recovery structure. A cooling of intraday momentum could allow the daily RSI to remain constructive while price consolidates beneath resistance.
A sustained rise in daily RSI alongside a breakout above $0.42 would provide stronger evidence that the recovery is developing beyond a temporary bounce.
MACD Adds Confirmation to the Bullish Case
MACD readings are also supporting the recovery.
Recent data showed the MACD line above the signal line with a positive histogram. One reading placed the MACD at 0.012281, the signal line at 0.002637, and the histogram at 0.009644.
Bitget’s more recent technical data showed MACD(12,26) at 0.01528 with a Buy signal.
The positive spread between the MACD and signal lines indicates that upside momentum has strengthened. This is consistent with Worldcoin’s move above $0.40 and reinforces the bullish signals produced by price action and RSI.
MACD should nevertheless be viewed as confirmation rather than a standalone forecasting tool. Because the indicator is derived from historical price data, it can lag behind turning points. A positive MACD therefore strengthens the recovery argument but does not prove that the long-term trend has reversed.
$0.42 Emerges as the Critical Breakout Barrier
The $0.40-$0.42 region has become the most important near-term battleground for WLD.
The token is already trading around the lower end of this range, making a sustained close above $0.40 increasingly important. A move through $0.41 would place $0.42 directly in focus.
The $0.42 level has additional technical significance because it sits close to the 0.382 Fibonacci retracement calculated from the approximately $0.23-$0.72 swing.
A clean breakout above $0.42 would therefore represent more than a psychological move. It would also mark a push through an important Fibonacci resistance level and strengthen the argument that Worldcoin’s recovery is progressing.
Beyond $0.42, attention would shift toward $0.44 and $0.46. The $0.47 region then becomes another significant technical hurdle.
Fibonacci Structure Maps the Medium-Term Upside
The Fibonacci retracement levels provide a useful framework for measuring how far the recovery could potentially extend.
The 0.236 retracement is located near $0.34, while the 0.382 level sits around $0.42. The 0.500 retracement is approximately $0.47.
This places the current WLD price between the first two major Fibonacci levels.
A successful move above $0.42 would therefore open the path toward the $0.44-$0.47 region. However, each level should be treated as a potential resistance area rather than a guaranteed target.
The $0.47 region could prove especially important because it represents the midpoint retracement of the recent $0.23-$0.72 range. Clearing it would indicate that buyers have recovered a substantial portion of the previous decline.
Above that area, the broader resistance structure extends toward $0.52. Reaching $0.52 would require Worldcoin to overcome several intermediate barriers and maintain strong buying pressure.
$0.34 Remains the Line Between Recovery and Weakness
While the upside levels are attracting attention, WLD’s downside structure may be even more important for determining whether the current rally remains intact.
Karim Beker highlighted $0.3590 on the four-hour Binance chart as an important support level. A pronounced lower wick around that price indicated that buyers stepped in after a sell-off.

The $0.3400 area represents another historical support level and has remained relevant since the recent recovery began.
Together, the $0.34-$0.36 region forms an important defensive zone for bulls.
A pullback that holds this area would leave the recent higher-low structure largely intact. Conversely, a sustained breakdown below $0.34 would significantly weaken the recovery thesis and increase the risk that WLD returns to lower levels.
This makes the $0.34-$0.36 zone an important area to monitor if the token fails to break through the overhead resistance.
Bollinger Bands Reflect an Expanding Volatility Range
Bollinger Bands also highlight the intensity of the latest move.
Recent readings placed the upper band near $0.41, the middle band around $0.35, and the lower band close to $0.28. WLD trading near $0.40 therefore places price close to the upper boundary of its recent volatility range.
Trading near the upper Bollinger Band is generally consistent with strong momentum. However, it can also signal that price has moved significantly above its recent average and may need to consolidate.
A sustained expansion beyond the upper band would support the case for continued volatility and momentum. Rejection around $0.41, on the other hand, could trigger a retreat toward the middle band and potentially the moving-average cluster around $0.36-$0.37.
Longer Timeframes Still Require Confirmation
The biggest caveat to the bullish setup comes from the longer-term technical picture.
TradingView’s broader technical ratings remain more cautious than the short-term indicators. While the selected timeframe currently shows a Buy rating for WLD/USD, the one-week and one-month ratings remain Neutral.
This divergence illustrates the difference between short-term momentum and long-term trend confirmation.
WLD’s recent rally has clearly improved its technical condition, but the token is still attempting to recover from a multi-year decline. A bullish signal on the daily chart cannot independently erase the larger historical downtrend.
For the broader trend to become convincingly bullish, Worldcoin would need to continue producing higher highs and higher lows while maintaining its position above key moving-average support and breaking through successive resistance levels.
What Could Happen Next for WLD?
The current Worldcoin setup can be divided into two broad scenarios.
The bullish scenario begins with WLD holding above $0.40 and breaking decisively through $0.41-$0.42. Such a move would strengthen the recent recovery and expose $0.44, $0.46, and $0.47 as the next major technical barriers.
A sustained move through $0.47 would further improve the medium-term structure and potentially place the wider $0.52 resistance region within reach.
The bearish or corrective scenario begins if the price fails to maintain the current momentum and falls back below $0.39-$0.38. The next major area would then be the $0.36-$0.37 moving-average cluster.
If that support fails, $0.35 becomes relevant, followed by the more significant $0.34 historical level. A sustained break below $0.34 would substantially weaken the current recovery structure.
WLD Price Outlook: Breakout or Consolidation?
As of August 27, Worldcoin’s technical setup has improved materially, but the market has not yet provided enough evidence to declare a full-scale long-term reversal.
The strongest bullish signals are coming from the SuperTrend flips, the move above the major moving-average cluster, positive MACD readings, and daily RSI levels above 50. The formation of higher lows also suggests that the market structure has improved from its previous bearish configuration.
However, the short-term RSI is already elevated, WLD is approaching the upper Bollinger Band, and the weekly and monthly TradingView ratings remain Neutral. These factors leave room for consolidation or a pullback before the next major move.
For bulls, $0.41-$0.42 is the decisive near-term hurdle. Clearing that area would bring $0.44-$0.47 into focus, while a stronger continuation could eventually expose $0.52.
On the downside, $0.39-$0.38 represents the first layer of support, followed by $0.36-$0.37. The $0.35-$0.34 region is the critical defensive zone that could determine whether the current recovery remains intact.
For now, the evidence favors an improving short-term recovery rather than a confirmed transformation of Worldcoin’s long-term trend. The next decisive move around the $0.42 resistance zone is likely to provide a clearer signal about whether Worldcoin can turn its latest rebound into a sustained advance.
Technical indicators are analytical tools rather than guarantees of future performance. Traders should consider broader market conditions, liquidity, Bitcoin’s direction, fundamental developments, and individual risk tolerance alongside technical signals when evaluating WLD.

Jack Spencer is a financial journalist and crypto market analyst covering digital assets, blockchain innovation, and global market developments. His reporting focuses on cryptocurrency price trends, regulation, institutional adoption, and the evolving digital asset ecosystem.
View all stories by Jack Spancer →