 BTC
BTC  ETH
ETH  USDT
USDT  BNB
BNB  XRP
XRP  USDC
USDC  SOL
SOL  TRX
TRX  ZEC
ZEC  FIGR_HELOC
  HYPE
HYPE  DOGE
DOGE  LINK
LINK  XMR
XMR 
Sui (SUI) Price Prediction: Rising Channel Holds as $0.74 Pivot Paves the Way Toward $0.78
Sui (SUI) is trading near the $0.74 area as a rising channel continues to shape its short-term price action. The structure has remained intact through several pullbacks, with buyers repeatedly defending the channel's lower boundary.


The latest setup puts the $0.7380-$0.7400 region at the center of the near-term SUI price prediction. This area has acted as a horizontal pivot throughout the recent advance. Holding above it could keep the upper half of the channel in play, while a sustained loss of the level would shift attention back toward the lower trendline.
Recent market data places SUI around $0.74, with a market capitalization of roughly $3 billion and about 4.05 billion SUI in circulation. CoinMarketCap lists the token’s maximum supply at 10 billion SUI, meaning a substantial portion of the eventual supply remains subject to future releases.
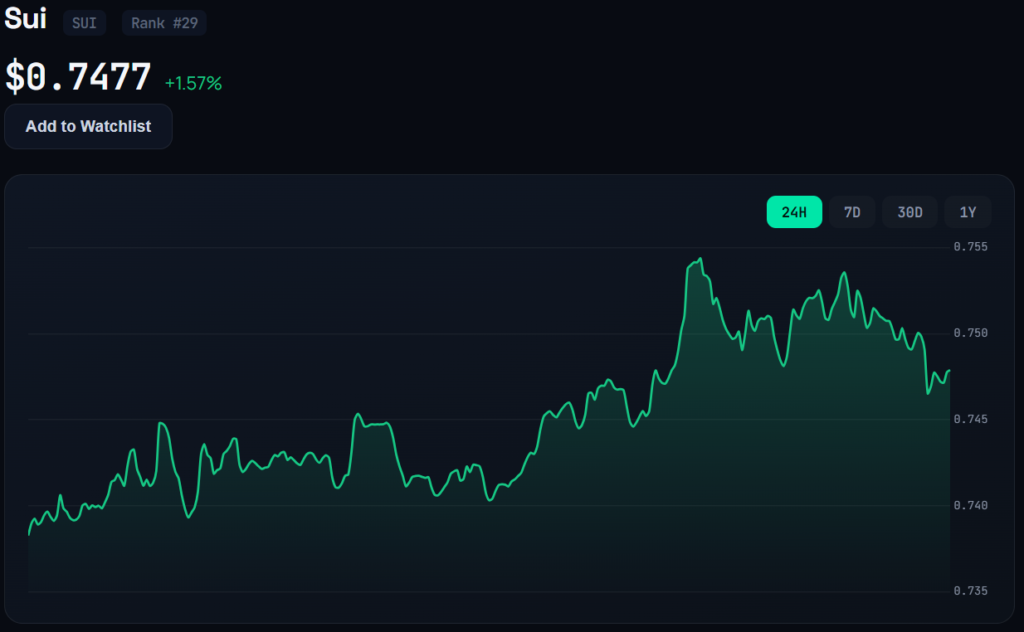
The broader technical picture, however, is not uniformly bullish. TradingView’s reported technical summary has been broadly neutral, with oscillators also showing a neutral reading. That suggests the current SUI crypto price action remains a balance between recovery attempts and overhead resistance rather than a confirmed trend reversal.
SUI Price Prediction: Rising Channel Keeps Bulls in Control
On the 4-hour SUI chart, the current structure can be described as a rising parallel channel that began forming after the late-June low around $0.6510. The lower boundary has gradually moved higher, linking subsequent lows near $0.6990 and $0.7100, while the upper trendline has repeatedly capped advances.
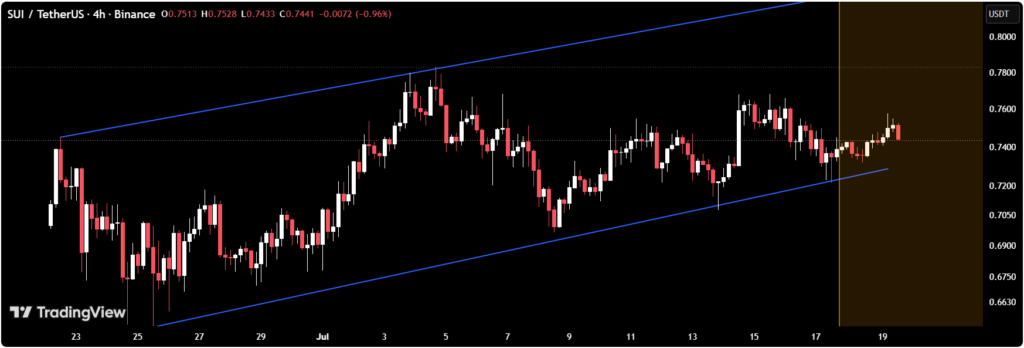
The $0.7380-$0.7400 region has emerged as the channel’s central pivot. Price has moved above and below this zone several times, making it an important reference point for the current SUI price prediction.
The latest pullback reached the lower channel area around $0.7100-$0.7150 before buyers stepped in. The subsequent recovery brought SUI back toward the $0.74 pivot, preserving the broader sequence of higher lows that defines the channel.
Technical analyst BKVIP described the setup as a channel that has held through multiple tests, with the third lower-trendline test again producing a rebound toward the central pivot. Under this framework, a sustained hold above $0.7380-$0.7400 would keep the upper channel boundary between $0.7650 and $0.7800 relevant.
That does not guarantee a breakout. Rather, it establishes a clearly defined technical path that traders can monitor as SUI develops its next move.
Key Levels To Watch
- $0.7750-$0.7800: Upper channel boundary and major dynamic resistance.
- $0.7650-$0.7700: Previous upper-boundary area and immediate resistance.
- $0.7500-$0.7550: Mid-upper channel resistance.
- $0.7380-$0.7400: Key horizontal pivot and current price zone.
- $0.7200-$0.7250: Intermediate support area.
- $0.7100-$0.7150: Rising lower trendline and important dynamic support.
- Below $0.6990: A potential channel breakdown zone that would weaken the current bullish structure.
The most immediate test is therefore the $0.7380-$0.7400 pivot. A successful defense could expose $0.7500-$0.7550 first, followed by the $0.7650-$0.7700 region. A stronger move through that resistance would bring the $0.7750-$0.7800 upper channel boundary into focus.
Conversely, failure to hold the pivot could send SUI back toward $0.7200-$0.7250. A deeper decline would put the rising trendline near $0.7100-$0.7150 under pressure. A confirmed close below the broader channel support near $0.6990 would invalidate the current rising-channel structure and introduce a more cautious SUI token price outlook.
SUI Chart Shows Tightening Price Action
A separate 4-hour chart shared by TheMoonShow highlights another feature of the current SUI chart: price compression within converging trendlines following a broader decline from above $1.10.
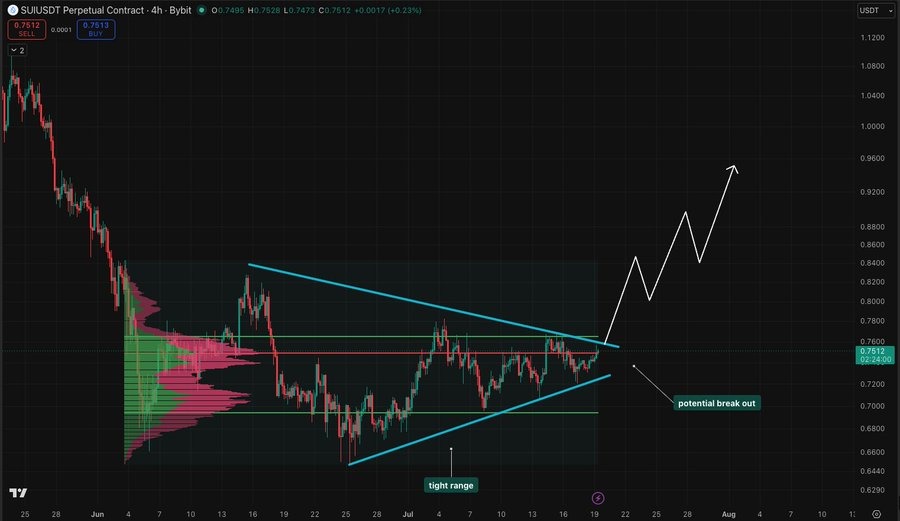
The chart identifies a relatively tight range around $0.75 and points to $0.84 as a potential technical target if price eventually breaks higher. This projection should be treated as a chart-based scenario rather than a confirmed SUI coin price prediction, as the move would require a clear breakout and supporting market participation.
The compression is nevertheless worth monitoring. When a market trades within a narrowing range, the eventual break can provide a clearer indication of the next directional move. In SUI’s case, a breakout above the recent resistance zones would need to be accompanied by stronger volume to provide greater confirmation.
Moving Averages Remain a Key Test
The moving-average structure adds another layer to the SUI crypto price prediction.
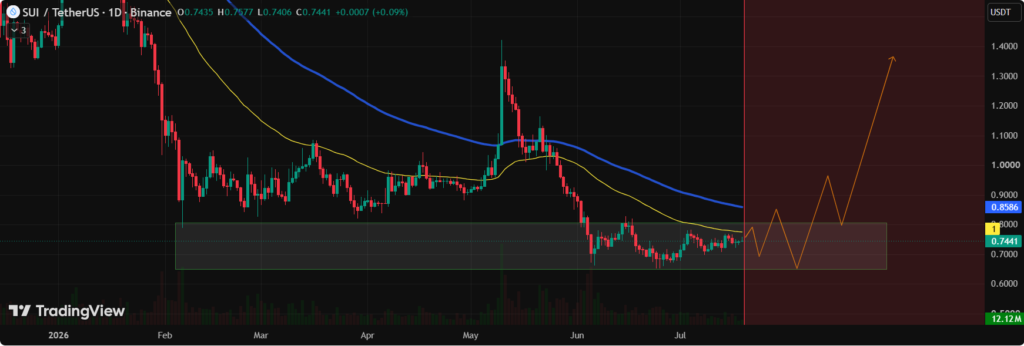
CryptoSkullSignal noted that SUI continues to hold its support area despite recent pullbacks, but identified the 50 EMA and 99 EMA as important hurdles. The analyst’s view was that a daily close above both averages could strengthen the recovery structure, particularly if those levels subsequently act as support.
This is a useful distinction between a short-term bounce and a more established recovery. Reclaiming a moving average is one step; holding above it on subsequent retests provides stronger evidence that market participants are willing to defend higher prices.
TradingView’s broader technical data, meanwhile, has presented a more measured picture. The overall rating has been reported as neutral, while oscillators including RSI, Stochastic %K, CCI, MACD, Williams %R, and other momentum measures have not collectively produced a strong directional signal.
Moving averages have also remained broadly neutral in the reported technical summary. This suggests that SUI is still in a transitional phase, with neither momentum indicators nor trend measures providing overwhelming confirmation of a sustained breakout.
Neutral Indicators Keep the SUI Price Prediction Balanced
The mixed technical readings are important when assessing the current SUI price.
Neutral oscillators indicate that the token is not showing an extreme overbought or oversold condition based on the cited TradingView framework. At the same time, the absence of a strong momentum signal means there is limited technical evidence to support an aggressive directional conclusion.
The broader time-frame picture is also worth considering. Shorter-term price action can improve while longer-term indicators remain less constructive. This divergence can occur during corrective rallies, particularly when an asset is attempting to recover from a larger decline.
For the current SUI coin price prediction, the result is a relatively clear technical decision zone. The $0.7380-$0.7400 pivot is the immediate level to watch, while $0.7100-$0.7150 represents the more important rising support zone. On the upside, $0.7650-$0.7700 and $0.7750-$0.7800 form successive resistance areas.
What Comes Next for SUI?
The immediate SUI price prediction remains closely tied to the $0.7380-$0.7400 pivot.
If SUI can establish support above this zone, the technical structure leaves room for a move toward $0.7500-$0.7550 before the market encounters the $0.7650-$0.7700 resistance area. A decisive break through that zone could bring the upper channel boundary near $0.7750-$0.7800 into focus.
The $0.84 level highlighted in the tighter-range setup represents a more ambitious upside scenario and would require SUI to first clear the established channel resistance. Without that confirmation, it remains a projection rather than a base-case target.
On the downside, losing the $0.7380-$0.7400 pivot would weaken near-term momentum and could expose the $0.7200-$0.7250 support area. A move toward $0.7100-$0.7150 would then test the rising lower trendline for a fourth time. A confirmed break below $0.6990 would provide a stronger technical warning that the rising-channel structure has failed.
For now, the SUI crypto price remains at a technically important crossroads. The rising channel continues to hold, but neutral momentum indicators and overhead moving-average resistance argue for confirmation rather than assumption. The $0.74 pivot, followed by the $0.77-$0.78 resistance zone, should therefore remain central to the near-term Sui price prediction.

Jack Spencer is a financial journalist and crypto market analyst covering digital assets, blockchain innovation, and global market developments. His reporting focuses on cryptocurrency price trends, regulation, institutional adoption, and the evolving digital asset ecosystem.
View all stories by Jack Spancer →
Responses
0