 BTC
BTC  ETH
ETH  USDT
USDT  BNB
BNB  XRP
XRP  USDC
USDC  SOL
SOL  TRX
TRX  ZEC
ZEC  FIGR_HELOC
  HYPE
HYPE  DOGE
DOGE  XMR
XMR  LINK
LINK 
Pepe Coin (PEPE) Price Prediction: Can PEPE Reclaim $0.00000580 Before Testing $0.00000915?


Pepe Coin (PEPE) is showing signs of consolidation after a prolonged decline, but the meme token has yet to overcome the technical barrier that could determine whether its broader downtrend is finally losing momentum.
PEPE has recently been trading in the $0.0000036-$0.0000038 area, with buyers defending a broader support region stretching from roughly $0.00000365 to $0.00000300. While that zone has helped stabilize the token, PEPE remains below a descending trendline that has capped several recovery attempts.
The current setup leaves traders watching two competing signals. Support and several medium-term moving averages suggest that selling pressure may be easing, while the long-term trendline continues to keep the broader structure bearish.
According to technical analysis from TradingView contributor CryptoNuclear, PEPE is approaching a “critical decision zone.” A sustained break above the descending trendline could mark a structural shift and open the door toward higher resistance levels, while a failure to hold support could expose the token to another leg lower.
$0.00000300 Is the Line Bulls Cannot Lose
The most important level on the downside is arguably $0.00000300.
PEPE’s current support structure extends from approximately $0.00000365 to $0.00000300, creating a relatively broad demand zone beneath the current price. Maintaining this region would allow the token to continue building a base and potentially make another attempt at its overhead trendline.
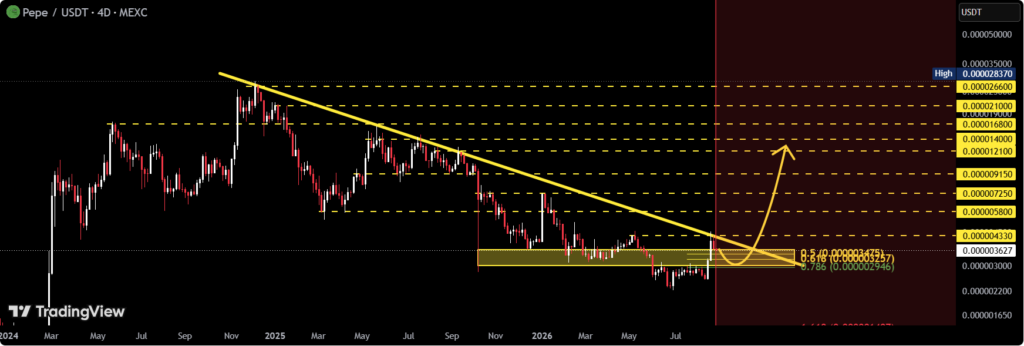
A clean candle close below $0.00000300 would tell a different story. CryptoNuclear’s four-day chart analysis identifies such a move as confirmation that the bearish structure remains intact.
Several Fibonacci retracement levels reinforce the importance of the area. The 50% retracement is positioned around $0.000003475, while the 61.8% and 78.6% levels sit near $0.000003257 and $0.000002946.
If sellers push PEPE beneath the latter levels, attention could shift toward approximately $0.00000250 and $0.00000200.
What Could Push PEPE Toward $0.00000915?
The upside case depends on one major technical event: a confirmed breakout from the descending trendline.
CryptoNuclear’s analysis suggests that a strong candle close above this resistance would provide the clearest evidence that PEPE’s longer-term bearish structure is beginning to weaken. A successful retest of the former resistance as support would offer additional confirmation.
If that breakout occurs, PEPE would still face several resistance zones rather than moving directly toward $0.00000915.
The first significant upside level is around $0.00000580. A successful move through that region could bring $0.00000725 into focus, followed by the more ambitious $0.00000915 level.
From a price near $0.0000038, reaching $0.00000915 would require a substantial advance. PEPE would therefore need to clear multiple technical barriers before that objective becomes realistic.
Beyond $0.00000915, the analysis highlights resistance near $0.00001210, $0.00001400, and $0.00001680. Higher levels around $0.00002100 and $0.00002660 are also identified, although reaching those areas would require considerably stronger momentum and confirmation from the broader market.
For now, $0.00000915 should be viewed as a potential technical objective rather than a guaranteed price target.
The Trendline Still Controls the Bigger Picture
Despite recent stabilization, PEPE’s broader chart remains constrained by a descending trendline extending from its previous major high.
Every recovery toward this line has the potential to attract sellers. As a result, the token has not yet produced the structural confirmation required to call a major trend reversal.
CryptoNuclear’s four-day PEPE/USDT analysis places the descending trendline close to the current horizontal support structure. This convergence makes the area particularly significant.
A breakout would potentially change the character of the chart. Conversely, another rejection could reinforce the existing bearish trend and send PEPE back toward its lower support levels.
The distinction between a brief move above resistance and a confirmed breakout will therefore be important. Traders may look for a strong closing candle followed by a successful retest rather than relying on a short-lived intraday spike.
Moving Averages Offer a More Constructive Signal
While the trendline remains bearish, PEPE’s moving-average structure provides a somewhat different picture.
The 20-period averages are currently positioned around $0.0000033-$0.0000034, while the 30-, 50-, and 100-period averages generally sit between approximately $0.0000030 and $0.0000033.
With PEPE trading above many of these medium-term averages, buyers retain some technical support beneath the current market price.
The shorter-term picture is less convincing. The 10-period moving averages are clustered around $0.0000037-$0.0000038, close to the current price, and have produced mild sell signals while PEPE remains below them.
This divergence suggests that short-term momentum has yet to turn decisively bullish even though the medium-term structure has become somewhat more supportive.
Volatility Keeps the Setup Uncertain
Bollinger Bands also point to a market that remains capable of sharp price movements.
The upper band is positioned near $0.0000045, with the middle band around $0.0000033 and the lower band close to $0.0000021.

PEPE is currently trading within the bands, meaning the token is not displaying an extreme reading based solely on this indicator.
A move toward the upper band could place the $0.0000045 region on traders’ radar before the larger $0.00000580 resistance level. On the other hand, renewed selling could push the price toward the middle and lower portions of the range.
Daily oscillators are also largely neutral, adding to the evidence that the market has not yet established a decisive direction.
A Breakdown Would Change the PEPE Outlook
The bearish scenario becomes significantly stronger if PEPE loses the $0.00000300 support level.
Such a move would undermine the current base-building thesis and reinforce the longer-term descending structure. The nearby $0.000002946 Fibonacci retracement would become an immediate reference point, followed by approximately $0.00000250 and $0.00000200.
The broader technical picture already warrants caution because PEPE remains well below its previous major high. Longer-term TradingView readings have also reportedly maintained a sell bias.
However, a single intraday breakdown would not necessarily confirm a sustained downtrend. Traders would likely need to monitor volume, momentum, and subsequent daily or four-day closes to determine whether sellers had achieved a genuine structural breakdown.
PEPE Price Levels That Matter Most
The current technical structure can be divided into several important zones.
Support:
- $0.00000365
- $0.00000350
- $0.00000340
- $0.00000300
- $0.000002946
- $0.00000250
- $0.00000200
Resistance and upside targets:
- $0.00000450
- $0.00000580
- $0.00000725
- $0.00000915
- $0.00001210
- $0.00001400
- $0.00001680
The immediate battle is between the $0.00000365-$0.00000300 support area and the descending trendline above the price.
A sustained move through the trendline would shift attention toward $0.00000580 and $0.00000725, with $0.00000915 becoming a larger potential target if bullish momentum continues.
Conversely, losing $0.00000300 would put the lower Fibonacci and structural levels back into focus.
What the PEPE Chart Needs Next
PEPE has reached a point where the next major move could provide more information about its longer-term direction.
The token has established support around $0.00000365-$0.00000300, while several medium-term moving averages are positioned beneath the current price. Those factors provide some foundation for a recovery.
However, the descending trendline remains the decisive obstacle.
A strong close above that resistance, followed by a successful retest, would offer the clearest technical evidence that the bearish structure is weakening. Such confirmation could create a path toward $0.00000580, $0.00000725, and eventually $0.00000915.
Failure to break the trendline would leave PEPE vulnerable to another test of its support zone. A confirmed close below $0.00000300 would invalidate much of the immediate bullish setup and increase the probability of a move toward $0.000002946, $0.00000250, and potentially $0.00000200.
For now, the PEPE price prediction remains conditional. The $0.00000915 objective is possible under a successful breakout scenario, but PEPE first needs to prove that buyers can overcome the descending trendline without losing the support structure underneath.

Jack Spencer is a financial journalist and crypto market analyst covering digital assets, blockchain innovation, and global market developments. His reporting focuses on cryptocurrency price trends, regulation, institutional adoption, and the evolving digital asset ecosystem.
View all stories by Jack Spancer →