 BTC
BTC  ETH
ETH  USDT
USDT  BNB
BNB  XRP
XRP  USDC
USDC  SOL
SOL  TRX
TRX  ZEC
ZEC  FIGR_HELOC
  HYPE
HYPE  DOGE
DOGE  XMR
XMR  LINK
LINK 
Bitcoin (BTC) Price Prediction: $80K Rally Faces Profit-Taking Risk as Bulls Approach $84K Resistance
Bitcoin has extended its recovery toward $80,000, but the latest advance is entering a technically important area where elevated trader profits, overbought momentum, and overhead supply could increase the risk of a pullback.


Bitcoin price was consolidating around $80,500 in the latest technical reading, up about 3.11% in the session. The move has kept the broader recovery structure constructive, although several momentum indicators suggest that the rally is becoming increasingly stretched.
The main warning comes from a potential bearish divergence developing on the higher-timeframe RSI. Crypto trader BitcoinHypers has pointed to a setup in which Bitcoin’s price is forming a lower high while the weekly momentum indicator is producing a higher high.
That configuration does not confirm a reversal. Instead, it highlights a potential mismatch between price and momentum that becomes more relevant as BTC approaches major resistance.
Meanwhile, on-chain data and market structure provide a more balanced picture. Glassnode’s Bitcoin Vector impulse has turned positive, while other analysis identifies substantial resistance between $83,307 and $84,569. The combination leaves Bitcoin at a critical technical juncture.
Bitcoin’s Rally Runs Into a Heavy Supply Zone
The next major test for the Bitcoin price is concentrated above $83,000.
AliCharts has identified the $83,307-$84,569 region as a significant resistance area using UTXO Realized Price Distribution data. Around 975,000 BTC were previously acquired within that range, creating a substantial concentration of historical buying activity.
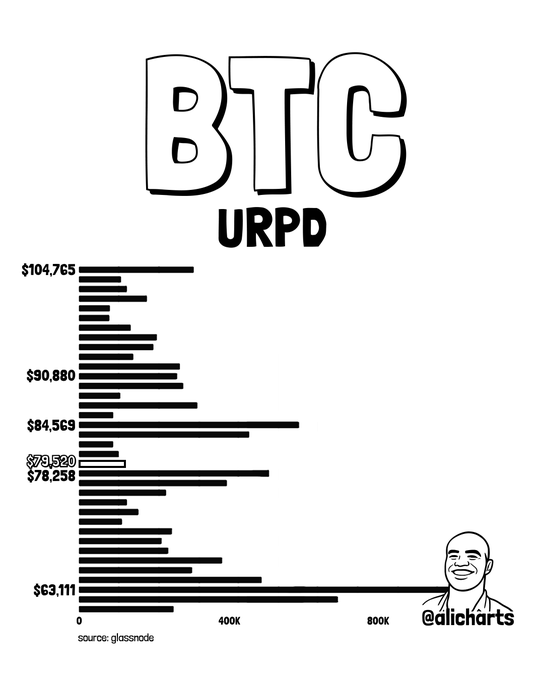
The zone is also close to Bitcoin’s May 2026 high near $83,000. This makes it both a historical price reference and an area where holders may reassess their positions.
If BTC reaches the zone without a meaningful increase in buying demand, existing holders with gains could use the advance to reduce exposure. A decisive breakout, however, would change the technical picture by showing that buyers can absorb the available supply.
For the current Bitcoin price prediction, the $83,000-$84,500 area is therefore more important than the $80,000 psychological level alone.
Weekly Momentum Sends a Warning
BitcoinHypers has highlighted a potential hidden bearish divergence on the weekly RSI.
The setup compares two different signals. Bitcoin’s price is making a lower high around the $80,000 region, while the weekly RSI is making a higher high. The divergence suggests that the oscillator is not confirming the same degree of weakness visible in the price structure.
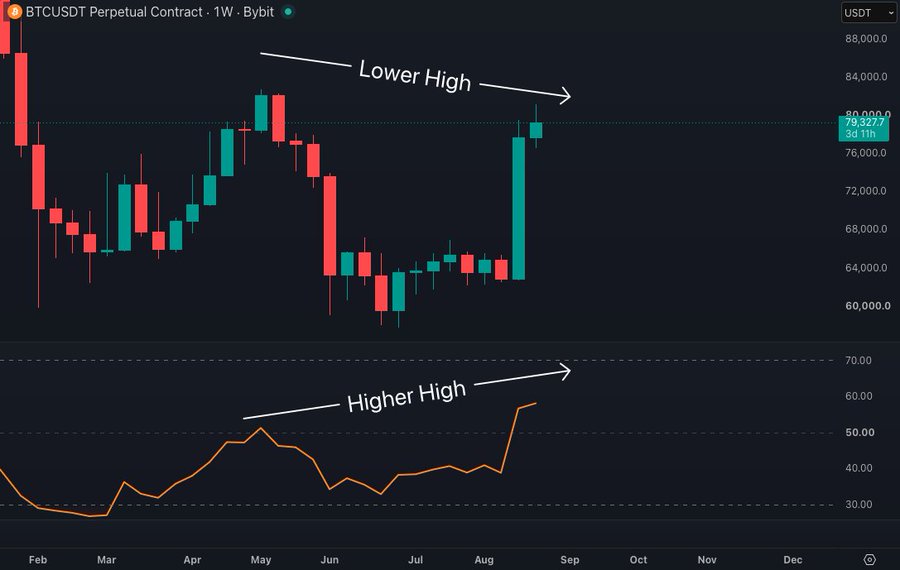
The trader, who has followed crypto markets since 2017, has also recently highlighted other higher-timeframe RSI signals and described the current setup as something requiring caution. Publicly indexed posts show BitcoinHypers continuing to monitor weekly RSI conditions and major trendline resistance.
A divergence should not be interpreted in isolation. Momentum indicators can remain elevated for extended periods during strong trends, and price can continue rising despite an early warning from an oscillator.
The more important confirmation would come from Bitcoin losing support and establishing lower highs and lower lows on the weekly chart.
Profit Margins Could Encourage Selling
On-chain positioning adds another layer to the Bitcoin outlook.
Recent analysis citing CryptoQuant data places Bitcoin trader profit margins around 25%. Similar levels have previously coincided with periods of profit-taking and short-term corrections, although the metric cannot determine when selling will begin or how deep a correction could become.

The issue is particularly relevant near $83,000-$84,500. AliCharts’ analysis combines the elevated profit margin with the large amount of BTC accumulated in that resistance zone, arguing that the combination could increase the probability of short-term selling.
This does not mean that a correction is guaranteed.
Profitability can remain elevated while the market continues higher if fresh demand absorbs existing selling pressure. The key question is whether buyers can overcome the supply concentrated above the current price.
Glassnode Sees Momentum Improving
The broader trend is not uniformly bearish.
Glassnode’s Bitcoin Vector impulse indicator has recently turned positive from its previous lows. According to data cited from the firm’s analysis, Bitcoin has gained roughly 20% since the indicator shifted into positive territory, while the strategy associated with the signal became fully allocated and profitable. The next upside reference identified by the analysis is $82,800.

The improvement in Vector momentum is important because it provides a counterpoint to the weekly RSI warning.
Rather than showing a market that has already turned decisively lower, the indicator suggests that the underlying recovery has strengthened. Glassnode’s broader Bitcoin Vector framework is designed to assess market regime conditions using on-chain and market data.
That leaves BTC with conflicting signals. Higher-timeframe momentum warrants caution, but the broader trend indicators still show improving conditions.
$82.8K Becomes the First Major Upside Test
Glassnode’s $82,800 level sits almost directly below the larger $83,307-$84,569 resistance band.
This creates an unusually concentrated area of technical interest. A move toward $82,800 would put Bitcoin close to both a Vector-derived target and a major historical supply zone.
The reaction around that area could provide more information than the initial approach toward $80,000.
If BTC moves through $82,800 and continues toward $83,307 without significant rejection, the market would begin testing the upper edge of the resistance band. A clean weekly close above $84,569 would provide stronger evidence that the supply zone has been absorbed.
Failure around the same area could instead reinforce the case for a consolidation phase.
A Pullback Would Not Automatically End the Recovery
AliCharts has compared the current market structure with Bitcoin’s 2022-2023 bottoming phase.
The comparison centers on a breakout above descending resistance followed by a retest and subsequent pullback. The historical pattern eventually developed into a larger recovery, but the analyst’s comparison should be treated as context rather than a forecast that Bitcoin will repeat the same path.

The 2026 market has different liquidity conditions and a different investor base. Institutional participation and exchange-traded fund flows also make a direct comparison with the earlier cycle difficult.
Still, the historical structure highlights an important technical principle: a breakout does not necessarily require uninterrupted upside.
A retest can occur without invalidating the broader recovery, provided the market establishes and holds a higher support level.
$77K-$78K Is the First Major Defensive Zone
If Bitcoin fails to clear the $83,000-$84,500 resistance area, attention would likely shift toward the $76,996-$78,258 region.
AliCharts identifies this range as an important support zone based on historical trading activity. Around 843,000 BTC were previously transacted in the area, giving it a significant concentration of market activity.
A pullback toward this zone would represent a relatively modest retracement from current levels. Holding the range would allow Bitcoin to consolidate while preserving much of the recent recovery structure.
A decisive breakdown would carry a different implication. It could signal that the latest breakout is losing strength and increase the possibility of a deeper retracement.
The distinction between a retest and a trend reversal would therefore depend heavily on how BTC behaves around $77,000-$78,000.
$63K Remains the Deeper Support Reference
Below the immediate support range, AliCharts has identified $63,111 as another significant demand area.
The level is associated with roughly 925,000 BTC of previous trading activity, making it considerably more substantial than the nearer $77,000-$78,000 zone.
A move toward $63,111 would represent a much deeper correction and would materially alter the current short-term structure.
It should therefore not be treated as an immediate downside target. Instead, it provides a reference for what could become relevant if Bitcoin loses the first major support area and broader market weakness develops.
For now, the $77,000-$78,000 range remains the more important level for determining whether a pullback is simply a retest or the beginning of a larger correction.
Technical Indicators Remain Divided
The latest technical readings also show why Bitcoin’s outlook is not straightforward.
BTC’s broader technical configuration remains supported by its moving averages, while several oscillators indicate that the recent advance has become stretched.
The 14-period RSI is around 81, well above the conventional 70 threshold often associated with overbought conditions. Stochastic readings are also elevated, while the Stochastic RSI, Commodity Channel Index, and Momentum indicators have produced sell signals.
These readings do not necessarily mean Bitcoin must fall. Strong trends can keep momentum indicators at elevated levels for extended periods.
The more constructive signal comes from MACD, which remains positive. This suggests that underlying upward momentum has not yet been fully undermined by the stretched oscillator readings.
The result is a market where the trend remains constructive, but the risk-reward profile becomes more sensitive to resistance and profit-taking.
$80,863 Adds to the Resistance Structure
Pivot analysis places another technical barrier close to Bitcoin’s current price.
The classic pivot calculation identifies $80,863 as the R3 resistance level, while the central pivot is much lower at $62,491. With BTC approaching $80,000, the upper pivot has become an immediate reference for traders monitoring the current advance.
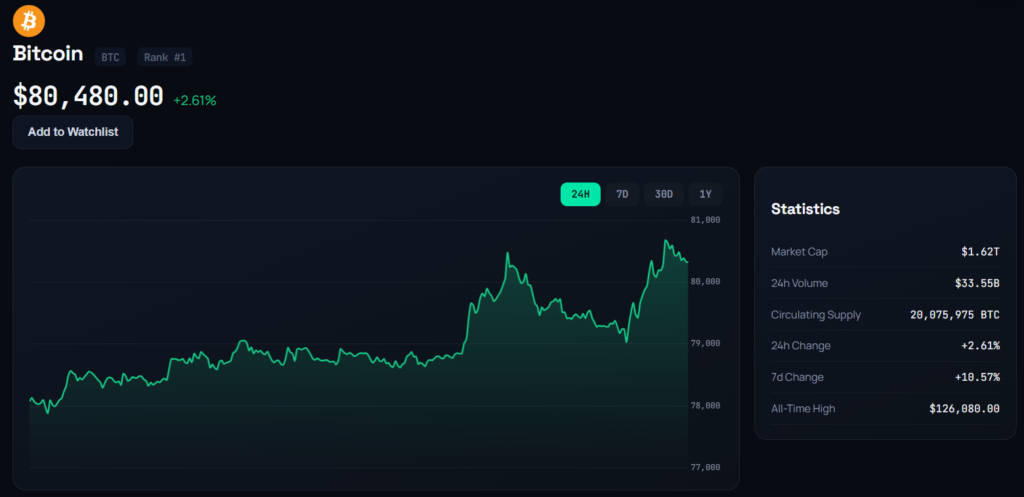
A move above $80,863 would remove one technical obstacle and increase the probability of a test of $82,800-$84,500.
Conversely, rejection around $80,000-$80,863 would leave the market vulnerable to consolidation, particularly if short-term momentum continues to weaken.
Because pivot levels are calculated from historical price data, they should be treated as reference points rather than precise forecasts.
Bitcoin Price Prediction: What Comes After $80K?
The near-term Bitcoin price prediction depends heavily on whether buyers can convert the current recovery into a sustained breakout.
The bullish case would involve BTC holding above the $77,000-$78,000 support area, clearing $80,863 and then moving through the $82,800-$84,500 resistance cluster.
A sustained break above $84,569 would provide considerably stronger confirmation that buyers have absorbed the supply concentrated around the May high. From there, attention could shift toward higher resistance levels and the longer-term $100,000 objective discussed by AliCharts.
The alternative scenario involves rejection below the resistance zone followed by a loss of $77,000-$78,000. That would increase the probability of a deeper retracement and bring the $63,111 demand area into consideration.
Neither scenario is confirmed at present.
BTC Price Outlook: Strong Trend Meets Rising Correction Risk
Bitcoin’s current setup is best described as constructive but increasingly sensitive to resistance.
The positive Bitcoin Vector impulse, strong position above key trend indicators, and recent 20% advance show that buyers have regained meaningful momentum. Glassnode’s $82,800 target also places the next major upside reference close to the resistance identified by volume and on-chain positioning.
At the same time, the potential weekly RSI divergence, elevated RSI readings, and 25% trader profit margins provide reasons to monitor the possibility of profit-taking.
The most important levels are now relatively clear. Bitcoin must overcome $80,863 and then the $82,800-$84,500 region to strengthen the bullish continuation case. On the downside, $76,996-$78,258 is the first major support zone, followed by $63,111 if the correction becomes significantly deeper.
The evidence does not yet confirm a bearish reversal. Instead, it suggests that Bitcoin’s recovery is approaching a zone where the market will need stronger demand to maintain its advance.
A rejection could produce a normal consolidation or retest, while a decisive breakout above the $84,500 area would provide stronger evidence that the bullish structure remains in control.
Technical indicators, historical comparisons, and on-chain metrics should be treated as analytical inputs rather than guaranteed forecasts. Bitcoin’s future price will also depend on liquidity, institutional flows, ETF activity, macroeconomic conditions, and broader cryptocurrency market sentiment.

Julia Thornton is a cryptocurrency reporter covering blockchain, digital assets, and financial technology. She reports on market developments, regulation, exchange activity, and industry trends, delivering timely and accurate coverage of the global crypto ecosystem.
View all stories by Julia Thornton →