 BTC
BTC  ETH
ETH  USDT
USDT  BNB
BNB  XRP
XRP  USDC
USDC  SOL
SOL  TRX
TRX  FIGR_HELOC
  ZEC
ZEC  HYPE
HYPE  DOGE
DOGE  XMR
XMR  USDS
USDS 
Hedera (HBAR) Price Today: HBAR Technical Rating Turns Bullish as Key Levels Remain in Focus
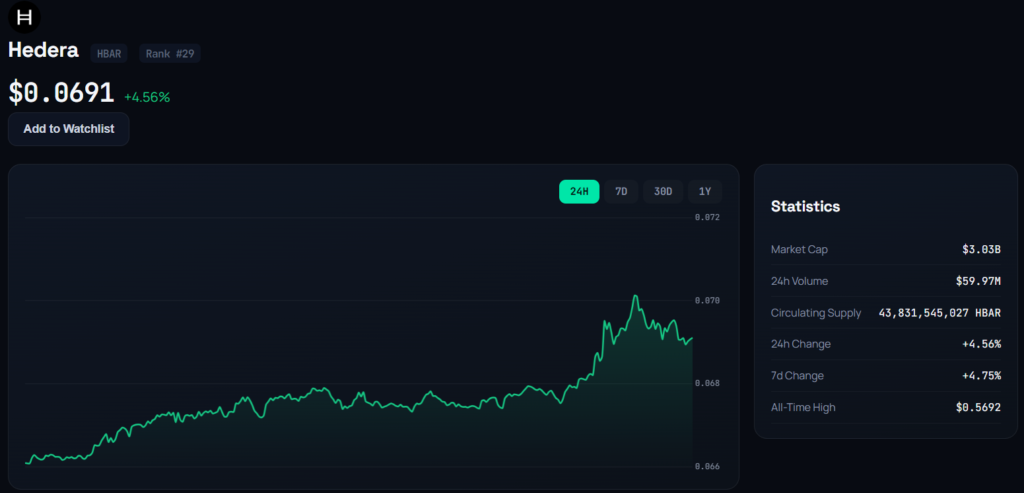
Hedera (HBAR) is trading near $0.068, with its latest technical readings showing a short-term improvement despite a weaker trend on longer timeframes.


TradingView’s HBAR technical page currently gives the token an overall buy rating, while both its one-week and one-month readings remain bearish.
The mixed signals leave Hedera Price at an important technical juncture. The latest TradingView data suggests that buyers have gained some control over the shorter-term setup, but the broader trend has yet to confirm a sustained reversal.
HBAR Price Today and Technical Outlook
TradingView lists HBARUSD at approximately $0.06763, with the token down about 0.15% over the previous 24 hours at the time of the latest market snapshot.
Its technical-analysis dashboard currently assigns an overall buy rating. Both the oscillator group and moving-average group are also rated buy, according to TradingView.
However, TradingView’s multi-timeframe assessment remains more cautious. The platform says the one-week rating has a prevailing sell trend, while the one-month rating shows a sell signal. This divergence suggests that the latest improvement is more pronounced on shorter timeframes than across the broader trend.
TradingView also notes that its technical ratings should not be used in isolation, as they reflect conditions across a collection of indicators rather than a definitive prediction of future price movements.
HBAR Tests a Broader Downtrend
HBAR has spent much of 2026 under pressure following its earlier advances. Recent market analysis places the token in a prolonged consolidation phase around the $0.068-$0.070 region after declining from significantly higher levels earlier in the year.
The market structure remains important because HBAR has struggled to establish a sustained series of higher highs. Recent analysis identifies approximately $0.0675-$0.068 as an important nearby support zone, while resistance has developed around $0.070-$0.075.
A move above the upper end of that resistance area would provide stronger evidence that momentum is changing. Conversely, a break below nearby support would keep the longer-term bearish structure in place.
CW8900’s HBAR Analysis
CryptoQuant-verified analyst CW (@CW8900) has previously highlighted major resistance zones in HBAR’s price structure. In an earlier analysis, CW identified the $0.32 area as a significant supply zone and described it as a “sell wall.” A break above that level was viewed as potentially opening the way toward $0.32 in the then-current setup.
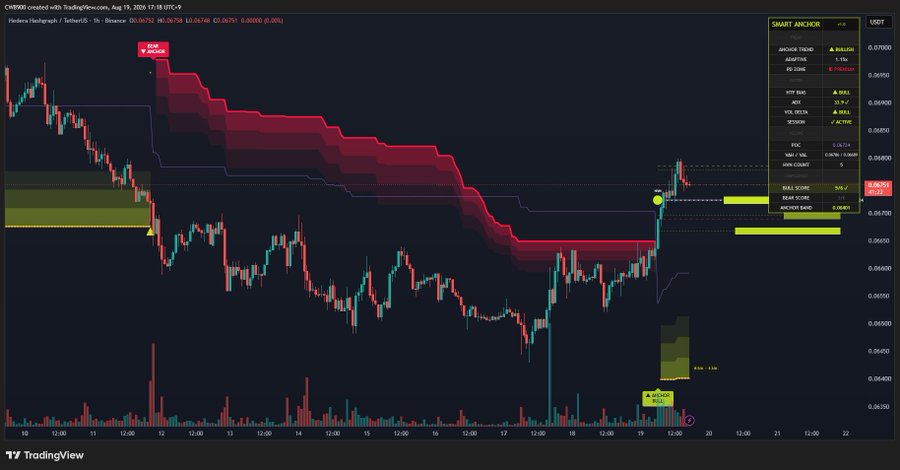
The analyst’s broader approach focuses heavily on market structure and liquidity rather than relying on a single technical indicator. CW’s profile describes his work as focused on “key on-chain data and chart analysis.”
The specific X post provided for this article could not be reliably retrieved in full, so its visual or numerical claims should not be treated as independently verified. The analysis therefore relies primarily on the accessible TradingView technical data and independently available market context.
Key HBAR Support and Resistance Levels
The current HBAR price remains close to a key short-term decision zone.
The first area to watch is $0.0675-$0.068, which has recently acted as nearby support. Maintaining this zone would allow the current short-term technical improvement to remain intact.
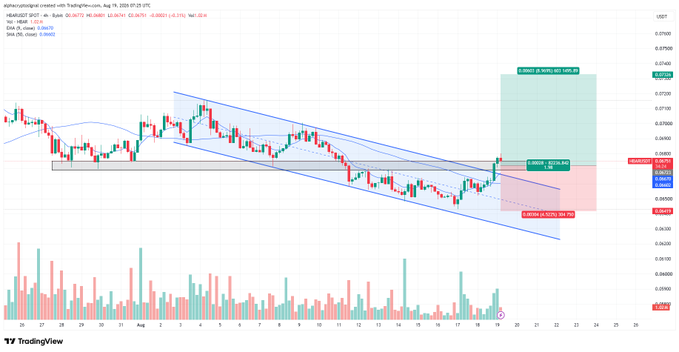
Above the market, $0.070-$0.075 represents the more important resistance region. A decisive daily close above $0.075 would provide a stronger indication that the recent consolidation is developing into a broader recovery.
On the downside, a sustained move below $0.0675 would weaken the near-term setup and could expose lower support levels. Some recent technical analysis identifies a larger historical demand zone around $0.0475-$0.0375, although that area remains well below current prices and should be considered a longer-term reference rather than an immediate target.
HBAR Price Today: What Comes Next?
The current Hedera setup is best described as short-term constructive but long-term uncertain.
TradingView’s latest technical dashboard gives HBAR a buy rating, with both oscillators and moving averages also showing buy signals. Yet the weekly sell trend and monthly sell signal demonstrate that the improvement has not fully translated into a broader trend reversal.
For HBAR price today, the $0.068 area remains the immediate reference point. Holding support while reclaiming $0.070 would improve the short-term structure. A sustained breakthrough of the $0.075 resistance area would provide a more meaningful technical confirmation.
Until that happens, HBAR remains in a market where short-term momentum and longer-term trend signals are pointing in different directions. Traders will likely focus on whether buyers can convert the current technical improvement into a sustained break above resistance rather than treating the latest buy rating as confirmation of a new uptrend.

Jack Spencer is a financial journalist and crypto market analyst covering digital assets, blockchain innovation, and global market developments. His reporting focuses on cryptocurrency price trends, regulation, institutional adoption, and the evolving digital asset ecosystem.
View all stories by Jack Spancer →