 BTC
BTC  ETH
ETH  USDT
USDT  BNB
BNB  XRP
XRP  USDC
USDC  SOL
SOL  TRX
TRX  ZEC
ZEC  FIGR_HELOC
  HYPE
HYPE  DOGE
DOGE  XMR
XMR  WBT
WBT 
Hyperliquid (HYPE) Price Prediction: Can the $75 Floor Hold Before Bulls Target $90 Again?
Hyperliquid's HYPE token is consolidating after a sharp advance pushed its price toward the $90 mark. The pullback has shifted attention from the recent rally to a narrower group of support levels that could determine the next phase of the move.


Hyperliquid is currently trading below its recent peak after encountering resistance around $88-$90. While the retreat has weakened short-term momentum, several technical setups continue to identify $75 as an important level for the broader bullish structure.
Hyperliquid Pullback Shifts Attention to the Support Structure
The recent decline follows an approximately 60% rally that carried HYPE toward $90. AH_Roshani’s TradingView analysis identifies the $75 region as a strong support area following that advance.
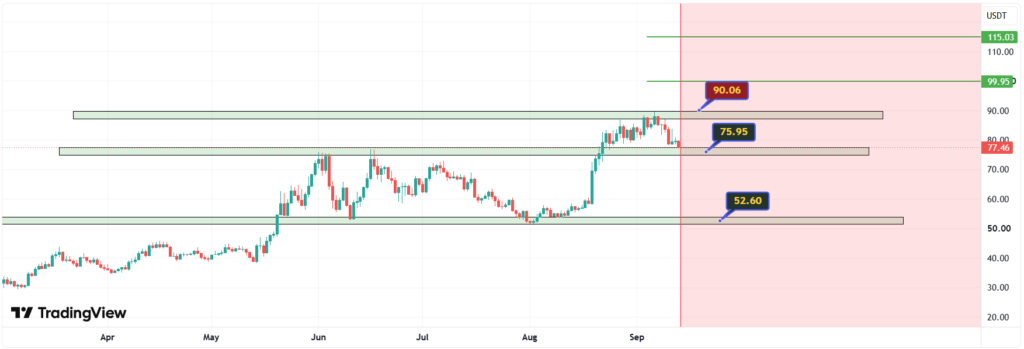
The analysis suggests that a hold above this level could allow Hyperliquid to recover toward its previous high. A break through the static resistance area with strong momentum would provide a stronger indication that buyers are attempting to establish another upward leg.
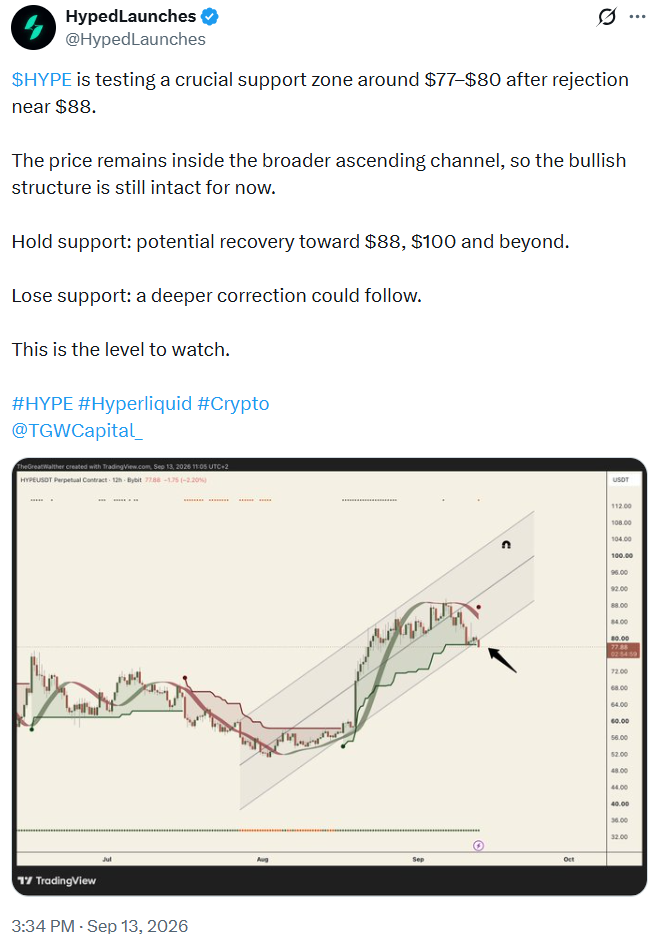
The $77-$80 area is also being monitored on the 12-hour chart. @HypedLaunches highlighted this zone as an important test while noting that the ascending channel remains in place.
That distinction gives the current correction some technical context. HYPE has retreated from resistance, but the broader channel has not yet been decisively broken.
Fibonacci Retracement Brings $70 Into View
The current correction also fits an Elliott Wave interpretation presented by Sophia-ElliottWave on TradingView.
The analyst describes the decline as a possible Wave II correction and identifies two Fibonacci retracement areas. The 38.2% level is positioned around $75, while the 50% retracement sits near $70.
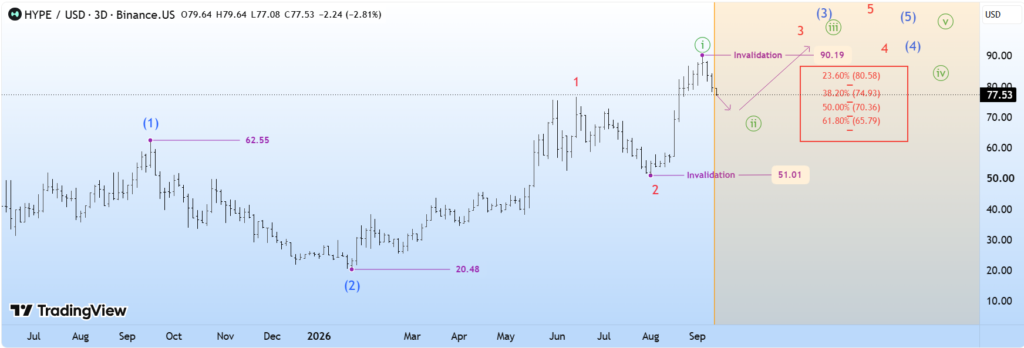
These levels create a potential range where buyers could attempt to regain control. However, Fibonacci ratios are reference points rather than confirmation of a bottom. Price action around each level remains important.
The same analysis identifies $51 and $90 as invalidation points for the proposed Wave II scenario. A move above $90 or below $51 would therefore require the current wave interpretation to be reconsidered.
Why $75 Matters for the HYPE Price Prediction
The $75 level has emerged as the central support reference across several technical views.
@CopySkylerBFX, who describes a focus on futures and technical analysis, also expects the correction to test $75. The accompanying two-hour HYPEUSDT chart identifies $75 as support, while the $88-$89 area represents an important resistance and liquidity zone.
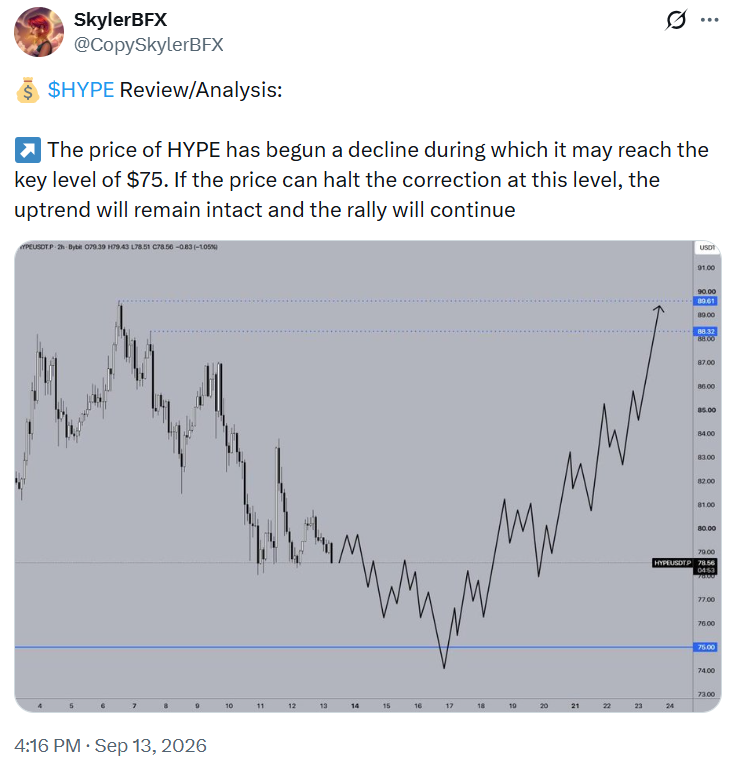
According to that setup, maintaining $75 would leave the broader uptrend intact. Above it, the previous high and liquidity around $88-$89 become the next areas to monitor.
The repeated appearance of $75 across different timeframes makes the level particularly relevant to the current HYPE price forecast. A reaction there could offer more information about the strength of demand than the recent rejection alone.
Hyperliquid’s Token Economics Remain Part of the Picture
Technical analysis is only one part of the Hyperliquid market story. The token is tied to Hyperliquid, a specialized Layer 1 blockchain focused heavily on decentralized perpetual futures trading.
Hyperliquid’s protocol also links trading activity with HYPE through its fee mechanisms. Its documentation states that applicable fees are used to purchase HYPE through the Assistance Fund, with those tokens subsequently burned.
This structure means activity across the protocol can have a direct relationship with Hyperliquid demand and supply dynamics. It does not, however, guarantee that increased protocol activity will translate into higher token prices.
For that reason, trading volume, market structure, and support levels remain important alongside the project’s token economics when assessing the Bitcoin-style question of where HYPE could move next.
$88-$90 Remains the Main Upside Barrier
For bulls, reclaiming the upper resistance area would be an important development.
Hyperliquid previously approached $90 before sellers forced the latest retreat. Both @CopySkylerBFX and AH_Roshani identify the area around the previous high as an important upside reference.
A recovery toward $88-$90 would therefore put HYPE back at the same region where the latest advance lost momentum. Buyers would need to absorb available selling pressure before a sustained breakout could become technically meaningful.
A clean move through that zone would strengthen the bullish case and potentially open the door to higher price targets. Until then, $90 remains resistance rather than an established destination.
HYPE Price Prediction: Two Levels Could Define the Next Move
The current chart presents a relatively clear technical framework. On the downside, $75 is the first critical level, with $70 representing the deeper Fibonacci retracement area identified in the Wave II scenario.
Hyperliquid (HYPE) price chart. Source: ChainTelegram/CoinGecko
If HYPE holds these levels and begins forming higher lows, attention could return to $88-$90. A breakout above the previous high would then provide stronger evidence that the recent correction has ended.
A sustained move below $75 would change the short-term picture. In that case, the $70 Fibonacci level could become the next area of interest, while a deeper decline would weaken the existing bullish channel structure.
For now, the available technical setups point to a correction within a still-developing broader uptrend rather than a confirmed reversal. The reaction around $70-$75 and any subsequent attempt to reclaim $88-$90 are likely to offer the clearest signals for the next phase of the HYPE price action.

Jack Spencer is a financial journalist and crypto market analyst covering digital assets, blockchain innovation, and global market developments. His reporting focuses on cryptocurrency price trends, regulation, institutional adoption, and the evolving digital asset ecosystem.
View all stories by Jack Spancer →