 BTC
 ETH
 USDT
 BNB
 USDC
 XRP
 SOL
 TRX
 FIGR_HELOC
 ZEC
 HYPE
 XMR
 DOGE
 USDS

Bitcoin (BTC) Price Prediction: ETF Demand Builds as $82K Becomes the Next Major Test
Bitcoin is once again testing the upper end of its recent trading range, but the market has yet to produce the confirmation needed to establish a fresh bullish trend.


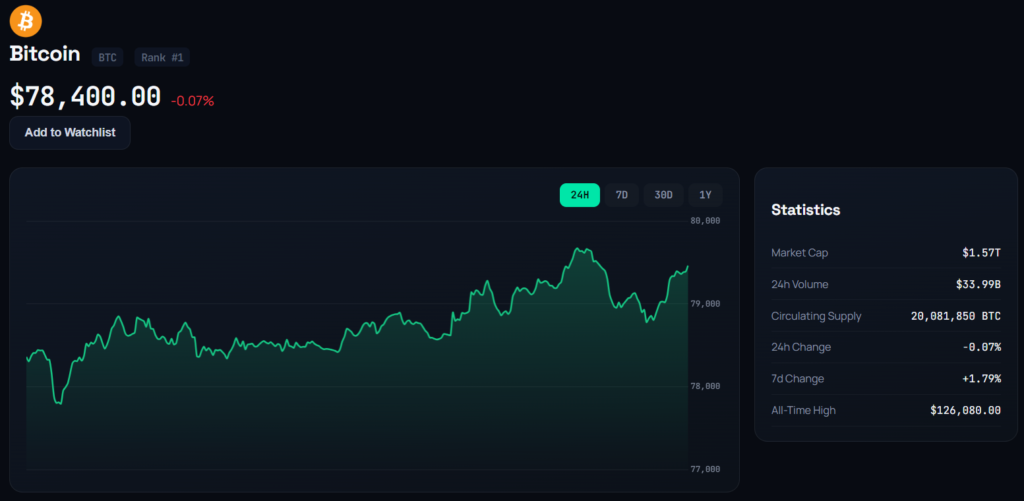
The Bitcoin price closed at $78,449 on September 8, according to the BITSTAMP BTC/USD data referenced in a recent TradingView analysis. The recovery has been supported by stronger institutional demand, improving on-chain conditions, and an absence of unusually large exchange deposits from major holders.
The biggest near-term hurdle sits above $80,000. A daily close beyond $82,833 would represent an important technical development and could shift attention toward the $83,500-$84,500 region.
For now, however, Bitcoin remains below that confirmation zone.
Institutional Money Returns to Bitcoin
One of the clearest changes in the market has been the increase in demand for spot Bitcoin ETFs.
Glassnode data showed $643 million flowing into U.S. spot Bitcoin ETFs in a single session last Thursday. It was the strongest one-day inflow since January 2026 and came after a particularly strong month for the funds.
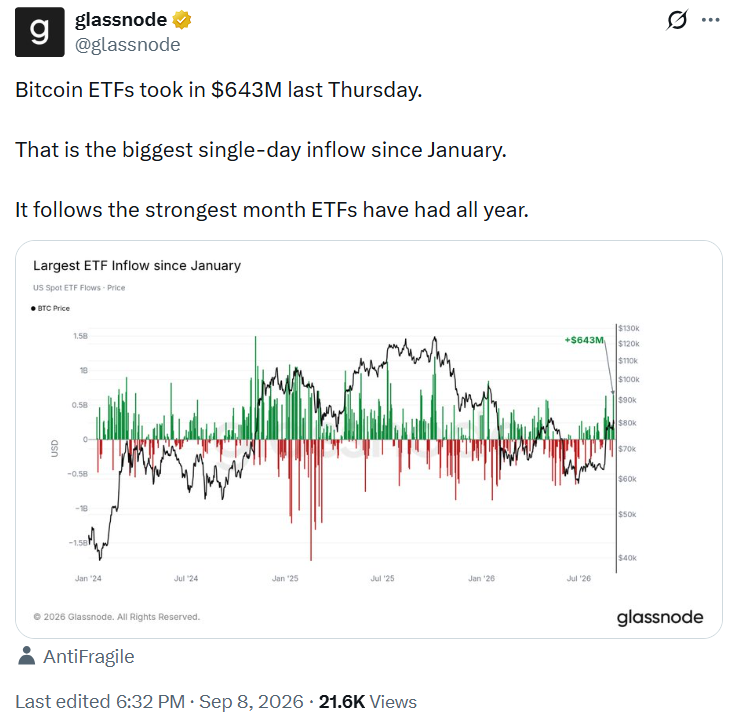
The renewed demand is significant because spot ETFs provide direct exposure to Bitcoin rather than relying solely on derivatives. Persistent inflows can therefore provide an additional source of spot-market demand when investors increase their allocations.
The broader weekly picture was also constructive. U.S. spot Bitcoin ETFs recorded approximately $986.9 million of net inflows in the week ending September 4, extending their positive run to three consecutive weeks. BlackRock’s IBIT represented roughly $691.5 million of the weekly total.
However, the flow data also highlights why investors should avoid treating one strong session as a definitive trend. U.S. spot Bitcoin ETFs subsequently registered about $46.6 million in net outflows on September 8.
That volatility means the direction of cumulative flows over several sessions is more useful than any single daily figure when assessing the Bitcoin price forecast.
BTC Faces a Crowded Resistance Zone
Bitcoin’s recovery has brought it close to a technically important area.
The TradingView analysis by pricewerk identifies $82,833 as the first major confirmation level. A completed daily close above it would put the $83,500-$84,500 resistance band in focus.
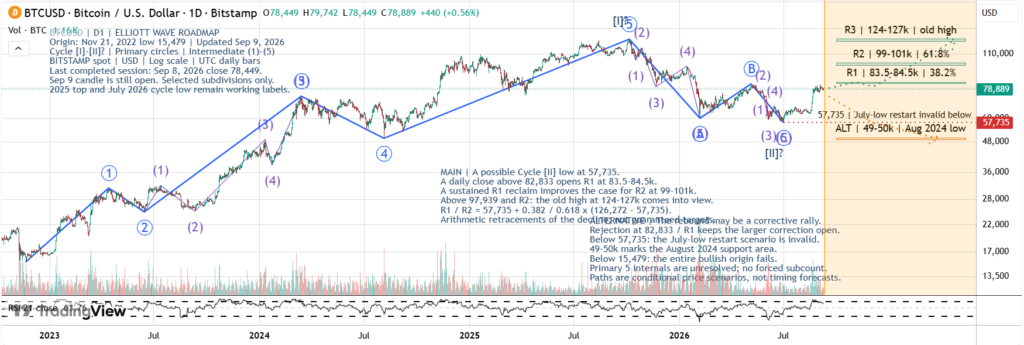
That zone is not arbitrary. It includes an arithmetic 38.2% Fibonacci retracement of the decline from the October 2025 high of $126,272 to the July 2026 low of $57,735. The resulting level is approximately $83,916.
Consequently, a move through $82,833 followed by acceptance above the $83,500-$84,500 area would provide a stronger signal than an intraday spike.
The distinction is particularly relevant for a Bitcoin price prediction today because the September 9 candle was still open in the cited analysis. An intraday move above resistance does not carry the same significance as a completed daily close.
What the On-Chain Data Says About Selling
The supply side of the market is providing another encouraging signal.
Bitcoin has moved back above its Warm Supply Realized Price, a Glassnode metric representing the average cost basis of coins that last moved between one week and six months ago.

When BTC trades above this level, relatively recent holders are, on average, back in profit. That can improve market structure because holders who accumulated during the preceding correction are no longer sitting on the same degree of unrealized losses.
Historical examples have also attracted attention. Previous major Warm Supply Realized Price reclaims were followed by substantial Bitcoin advances, including gains of 69% in January 2023, 159% in October 2023, 74% in October 2024, and 34% in April 2025.
Those figures provide historical context, not a forecast. Market conditions, liquidity and investor positioning were different during each episode. The current reclaim should therefore be viewed as a supporting indicator rather than evidence that BTC is destined to repeat those returns.
Exchange-flow data offers another piece of the puzzle.
CryptoQuant analyst Woominkyu reported that the top 10 spot-exchange inflows reached 5,442 BTC on September 8. Although the figure increased from the previous session, it was only about 5.1% above its 30-day average.
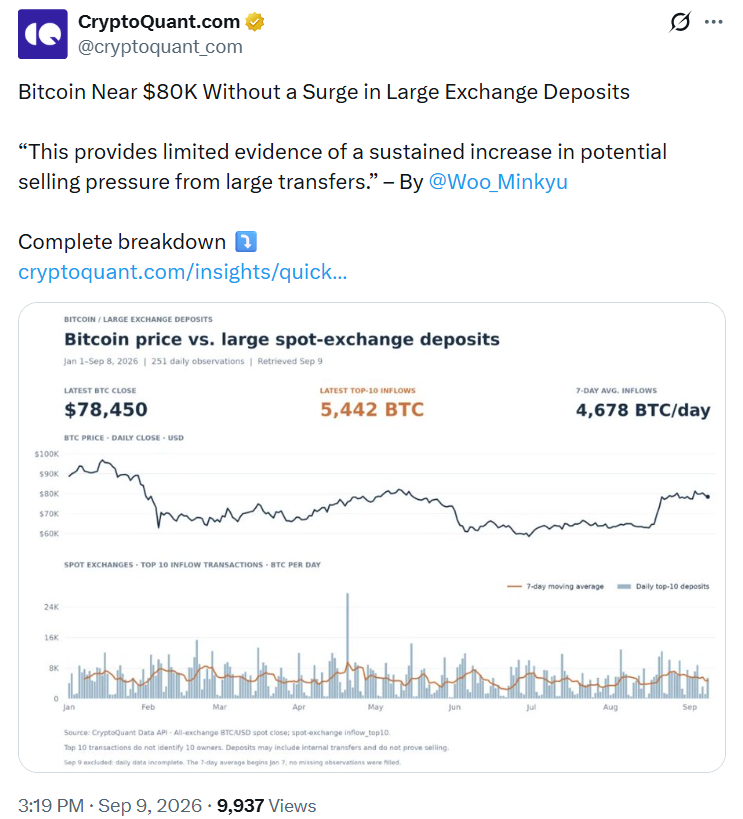
The seven-day average was approximately 4,678 BTC per day, remaining below several earlier peaks recorded in 2026.
Woominkyu characterized the recent increase as closer to normalization than an exceptional transfer event. In practical terms, there is currently limited evidence from this metric that large holders are aggressively sending Bitcoin to exchanges to sell.
That does not eliminate downside risk. It simply means the latest move toward $80,000 has not been accompanied by an unusually large wave of deposits from major holders.
A Rebound Is Not Yet a Confirmed Bull Market
The longer-term technical picture remains less certain.
The Elliott Wave framework referenced in the TradingView analysis traces Bitcoin’s larger advance from the November 2022 low of $15,479 to the October 2025 peak at $126,272. The subsequent decline is interpreted as a potential A-B-C correction that may have reached a low of $57,735 on July 1, 2026.
But the analyst deliberately treats that interpretation as provisional.
This is an important qualification. Elliott Wave counts can change as new price data develops, and the analysis itself acknowledges that some higher-degree wave structures remain unresolved.
The practical question is therefore not whether the July low must be the end of the correction. Instead, traders can watch how Bitcoin behaves around successive resistance levels.
A sustained breakout would strengthen the argument that the July low marked a meaningful cycle bottom. Failure at resistance would leave open the possibility that the current advance is still corrective.
$100K Comes Into View Only After Several Confirmations
The next major objective in the cited technical framework is considerably higher than the current Bitcoin price.
If BTC clears $82,833 and subsequently establishes support above the $83,500-$84,500 resistance band, the next area to monitor would be approximately $99,000-$101,000.
That region corresponds to the 61.8% arithmetic retracement of the decline from $126,272 to $57,735. The calculation produces approximately $100,091.
Bitcoin’s previous intermediate high around $97,939 would provide another technical checkpoint before the market reaches that zone.
A decisive move above both $97,939 and the $99,000-$101,000 region would materially improve the longer-term recovery structure. Only beyond those hurdles would the $124,000-$127,000 area surrounding the previous record high become a more relevant technical reference.
This step-by-step approach is more useful than assigning a distant target to BTC without considering the resistance levels between the current price and that objective.
What Could Derail the Bitcoin Recovery?
Bitcoin does not need to break $82,833 immediately, but repeated rejection near that area would weaken the short-term bullish setup.
A failure around $82,833 or the $83,500-$84,500 band would keep the corrective-rebound scenario active. In that case, investors would likely pay closer attention to lower support levels rather than assuming that the next leg higher has already begun.
The July low of $57,735 is the critical structural reference in the Elliott Wave framework. A break beneath it would undermine the proposed recovery from the July bottom.
A much deeper alternative zone sits around $49,000-$50,000, near the August 2024 low of $49,577. The November 2022 low of $15,479 represents the far broader invalidation point for the bullish cycle structure.
These levels should not be confused with automatic trading stops. They are structural reference points within the technical analysis.
Bitcoin Price Prediction: Confirmation Matters More Than the Target
The current setup gives Bitcoin several reasons for investors to watch the $82K region closely.
Strong spot ETF inflows have returned, the Warm Supply Realized Price has been reclaimed, and large exchange deposits have not shown an exceptional surge as BTC approaches $80,000.
At the same time, Bitcoin remains below a resistance cluster that has yet to be decisively cleared.
For the Bitcoin price prediction 2026, the most important development may therefore be a confirmed daily close above $82,833 followed by sustained acceptance around $83,500-$84,500. Such a move would make the $99,000-$101,000 area a more credible subsequent technical objective.
Until that confirmation arrives, the market remains in a decision phase. ETF demand and on-chain data have improved, but price action still needs to validate the bullish case.
The immediate question is straightforward: can BTC turn the $82K resistance area into support? The answer could determine whether the current recovery develops into a broader advance or remains another rebound within the larger correction.

Jack Spencer is a financial journalist and crypto market analyst covering digital assets, blockchain innovation, and global market developments. His reporting focuses on cryptocurrency price trends, regulation, institutional adoption, and the evolving digital asset ecosystem.
View all stories by Jack Spancer →