 BTC
 ETH
 USDT
 BNB
 USDC
 XRP
 SOL
 TRX
 FIGR_HELOC
 ZEC
 HYPE
 DOGE
 XMR
 USDS

Bitcoin (BTC) Price Prediction: Cycle Theory Signals a Final Leg Down as BTC Tests $64K
Bitcoin (BTC) is facing another test of key support levels as the cryptocurrency consolidates around $64,000-$65,000.


The latest market structure has fueled a debate among analysts over whether the Bitcoin price is approaching the end of its current correction or remains vulnerable to another decline.
A cycle-based analysis shared by crypto market commentator AlΞx Wacy argues that Bitcoin may be entering the final stage of its current downtrend. The thesis is based on a historical timing pattern that compares roughly 1,064 days of market expansion with approximately 365 days of correction.
However, this framework remains a market hypothesis rather than a proven forecasting model. Historical cycles have varied in duration, and Bitcoin’s price is influenced by factors that cannot be captured by a calendar-based model alone.
Meanwhile, technical indicators are presenting a more cautious picture. Bitcoin’s overall TradingView technical rating was neutral as of the data reviewed around July 23, with short-term support competing against resistance from longer-term trend measures.
Bitcoin Cycle Theory Points to a Potential Final Correction
AlΞx Wacy described the current market phase as “THE FINAL LEG DOWN,” arguing that Bitcoin’s cycle structure has remained consistent over the past decade.
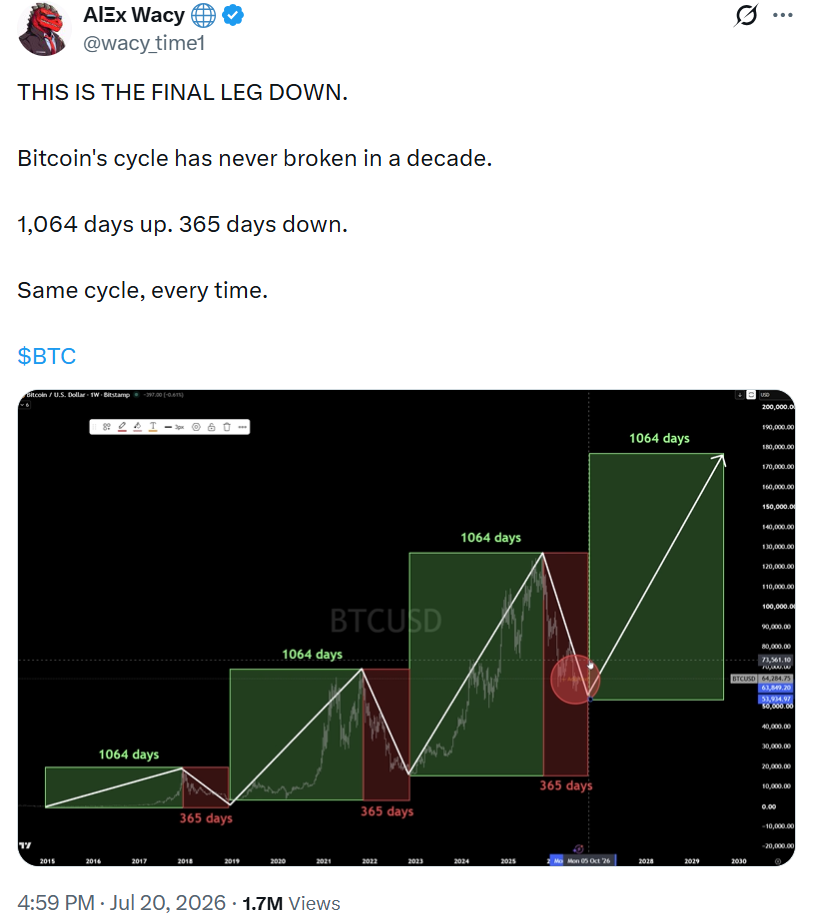
According to the analysis, previous major cycles followed a pattern of approximately 1,064 days of upward movement followed by about 365 days of correction. The current cycle is presented as following a similar path, with the latest major peak placed near $126,000 in October 2025 and Bitcoin now trading in the $60,000-$65,000 region.
The model suggests that the current correction could continue into 2026 before the market reaches a potential cycle low.
This interpretation is broadly consistent with the 1,064-day/364-day framework discussed by other market observers. The model describes a roughly three-year expansion phase followed by approximately one year of decline. However, it is important to note that the framework is a timing hypothesis, not a price-target model, and it does not establish that Bitcoin must follow the same pattern in every cycle.
The historical record itself provides some support for the timing argument. Across completed cycles, the time between major lows and subsequent peaks has been relatively similar. However, the number of completed cycles remains limited, making it difficult to establish the pattern as a reliable standalone forecasting tool.
Bitcoin Price Prediction Faces a Technical Test Near $64K
Bitcoin’s immediate technical structure is less conclusive than the longer-term cycle theory.
The BTC price was around $64,830 in the TradingView technical data reviewed for July 23, representing a decline of approximately 1.9% on the day. The broader market capitalization was estimated at around $1.30 trillion.
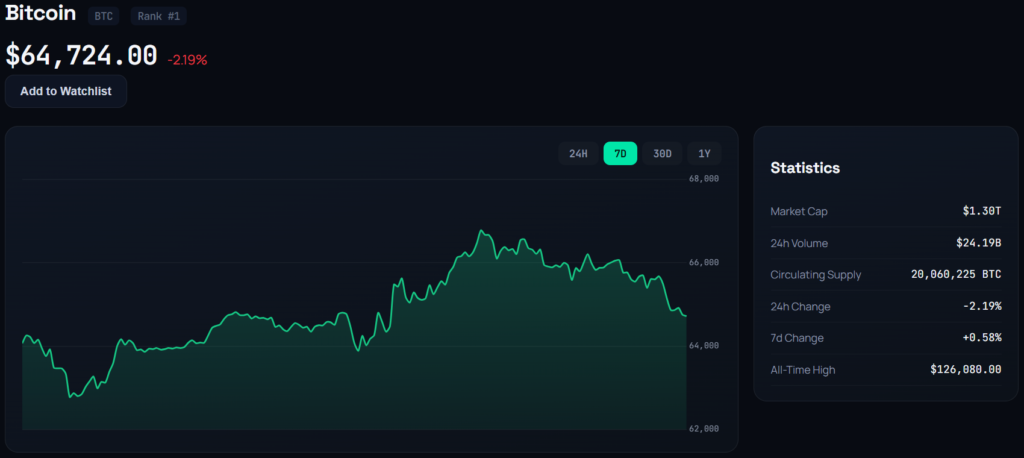
TradingView’s overall technical rating was Neutral. The oscillator group also carried a Neutral reading, with one sell signal, eight neutral readings, and two buy signals.
The 14-period Relative Strength Index (RSI) stood at 53.07. This places the indicator near the midpoint of its range and suggests that Bitcoin was neither in overbought nor oversold territory.
The Average Directional Index (ADX) was around 18.6. An ADX at this level generally points to limited trend strength, supporting the possibility of range-bound trading rather than a decisive directional move.
Momentum (10) and MACD Level (12, 26) were among the indicators producing buy signals. In contrast, Bull Bear Power generated a sell signal. The combination points to conflicting short-term forces rather than a confirmed trend reversal.
For the Bitcoin price prediction today, this distinction is important. A neutral RSI does not establish a bottom, while positive MACD and momentum readings alone do not confirm that a larger bullish cycle has begun.
Descending Channel Keeps $64K in Focus
Another technical analysis of BTCUSD places Bitcoin inside a descending channel that has guided the recent decline.
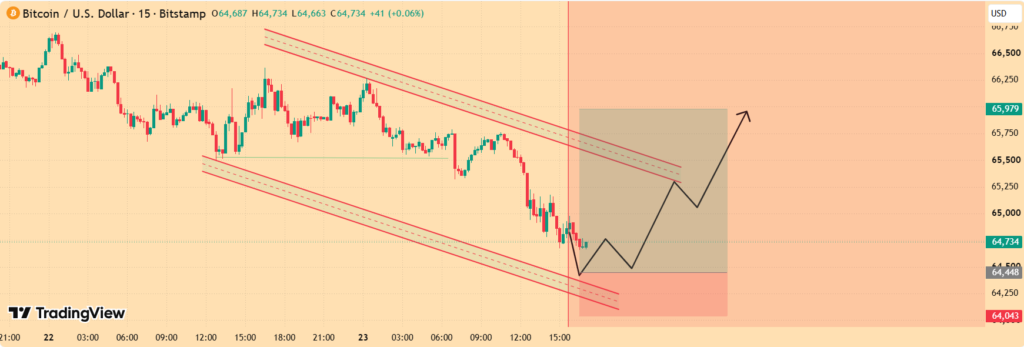
The latest move has brought price toward the lower boundary of that channel, where selling pressure appears to have moderated. The analysis identifies $64,300-$64,000 as the primary support zone.
On the upside, resistance is located at $65,200, $65,500 and $66,000.
A move above $66,000 would provide an initial sign that buyers are gaining control of the short-term structure. A stronger breakout through the channel’s upper boundary would offer additional confirmation.
Until that happens, Bitcoin could continue moving between support and resistance. This would be consistent with the low ADX reading and the neutral aggregate technical rating.
The current setup therefore leaves the $64,000 area as an important short-term reference point. A sustained break below it could increase downside pressure, while a successful defense could allow BTC to retest the nearby resistance levels.
Moving Averages Show a Divided Bitcoin Forecast
Bitcoin’s moving-average structure adds another layer of uncertainty to the current Bitcoin forecast.
The 10-period EMA and SMA were both generating sell signals, suggesting that BTC was struggling to maintain momentum above its shortest-term trend measures.
At the same time, several 20- and 30-period moving averages were providing more supportive signals. These averages indicate that Bitcoin still has some intermediate-term technical support despite the recent weakness.
The picture becomes more cautious across longer timeframes. The 50-, 100- and 200-period averages were predominantly showing sell signals, with Bitcoin trading below the longer-term trend measures.
This creates a clear divide in the technical outlook. Shorter-term indicators leave room for a rebound, but the broader structure remains under pressure until Bitcoin can reclaim higher moving averages.
The $64,000-$64,200 area therefore represents an important near-term zone. Holding it could keep the market in consolidation, while a breakdown could expose BTC to lower support levels.
Bitcoin Price Prediction: What Happens Below $64K?
The $64,000 level is emerging as a key dividing line for the short-term Bitcoin price prediction.
A sustained move below the $63,500-$64,000 area could reinforce the bearish interpretation and potentially expose Bitcoin to lower support zones. The classic pivot point cited in the technical analysis was around $63,515.
Conversely, maintaining support and reclaiming $65,200 could improve the short-term structure. A move above $65,500 and $66,000 would provide additional evidence that buyers are attempting to reverse the recent downtrend.
The next major upside reference from the technical analysis is around $68,995, corresponding to the classic R1 pivot level.
This leaves Bitcoin in a relatively narrow decision zone. The market needs to either defend support and establish higher highs or lose the $64,000-$63,500 area and confirm that sellers remain in control.
Bitcoin Forecast Remains Divided Between Cycle and Technical Signals
The current Bitcoin forecast is shaped by two competing interpretations.
The cycle thesis argues that BTC may be completing a historically familiar correction phase. AlΞx Wacy’s analysis points to a potential final bearish leg based on the 1,064-day expansion and roughly 365-day correction framework.
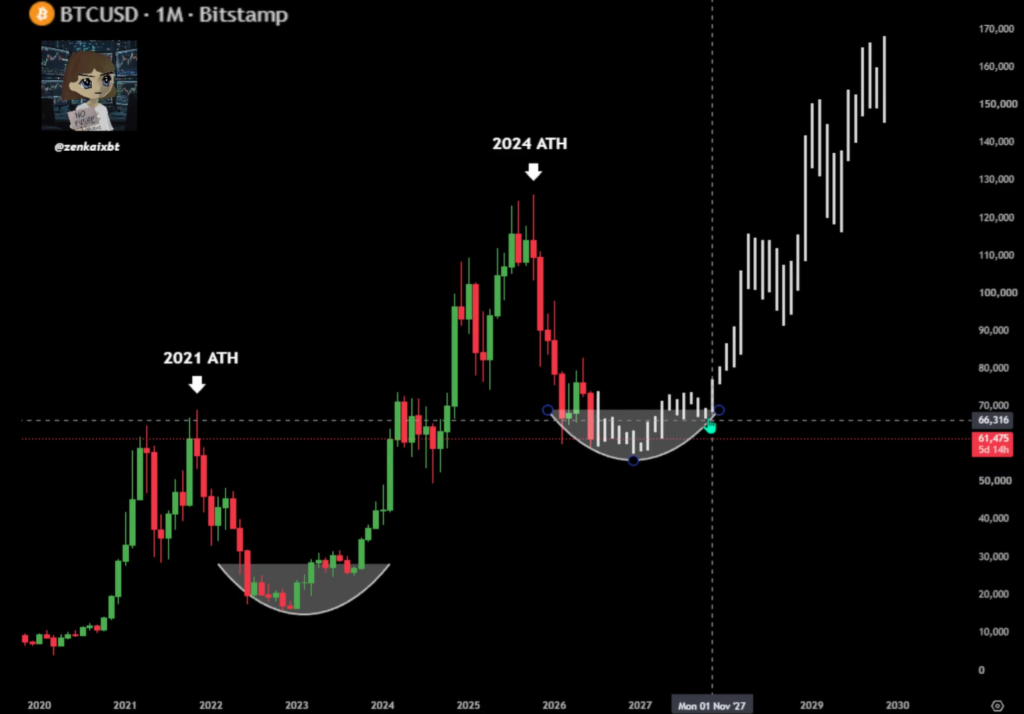
A separate analysis from @zenkaixbt takes the opposite view, stating that “Bitcoin’s bottom is in” and that a major new bull phase could be starting. The accompanying monthly chart highlights previous all-time highs and a rounded-bottom structure, with a long-term bullish projection extending into the 2030s.
Neither view can be confirmed by the current price action alone.
Bitcoin remains below several longer-term moving averages, while its RSI is neutral and its ADX indicates weak trend strength. At the same time, ETF flows have returned to positive territory at various points in July, providing evidence of continued demand from some institutional investors.
The result is a market that remains technically undecided.
BTC Price Outlook
For the immediate BTC price outlook, $64,000 is the first level to watch, followed by the $63,500 pivot area. A decisive breakdown could strengthen the case for another leg lower and give greater weight to the cycle-based bearish thesis.
On the other hand, a sustained recovery above $66,000 would begin to challenge the descending-channel structure. A move toward the $68,995 pivot resistance could then become possible if momentum improves.
The longer-term Bitcoin price prediction remains more uncertain. Cycle analysis can provide historical context, but it cannot account for changing market conditions, institutional flows, macroeconomic developments or shifts in investor behavior.
For now, Bitcoin’s price action around $64,000-$66,000 is likely to remain central to the market debate. A break in either direction could provide a clearer signal about whether the current correction is approaching its later stages or whether Bitcoin remains vulnerable to further downside.

Jack Spencer is a financial journalist and crypto market analyst covering digital assets, blockchain innovation, and global market developments. His reporting focuses on cryptocurrency price trends, regulation, institutional adoption, and the evolving digital asset ecosystem.
View all stories by Jack Spancer →
Responses
0