 BTC
 ETH
 USDT
 BNB
 USDC
 XRP
 SOL
 TRX
 FIGR_HELOC
 ZEC
 HYPE
 XMR
 DOGE
 USDS

Bitcoin (BTC) Price Prediction: Age Consumed Spike Signals Potential Volatility as BTC Tests $65K
Bitcoin is approaching a technically important area after recovering from its early-July lows, while an unusual spike in the movement of previously dormant coins has raised questions about the potential for increased volatility.


The Bitcoin price was trading around $64,000 on July 18, with the market still attempting to establish a clear direction after briefly moving above the $65,000 level earlier in the week. Bitcoin had reached a monthly high of around $65,500 on July 15 before retreating toward $64,000 as profit-taking and broader risk-off pressure weighed on the market.
Against this backdrop, a post from market analyst Ali Martinez, known on X as @ali_charts, highlighted a sharp increase in Santiment’s “age consumed” metric. The indicator tracks the movement of coins based on both the number of tokens transferred and the length of time those coins have remained dormant.
A significant increase in age consumed does not, by itself, indicate whether the Bitcoin price will rise or fall. Instead, it signals that older coins are moving on-chain, potentially reflecting changes in the behavior of long-term holders. Such activity can become more important when it coincides with major technical resistance or a period of heightened market uncertainty.
Bitcoin Price Faces Volatility Risk as Age Consumption Surges
According to the data highlighted by @ali_charts, Bitcoin’s age consumed metric recorded a sharp spike over the 24 hours leading into July 17. The move occurred while BTC was trading near the $63,000 region, drawing attention because substantial movements of dormant coins can precede periods of increased price activity.
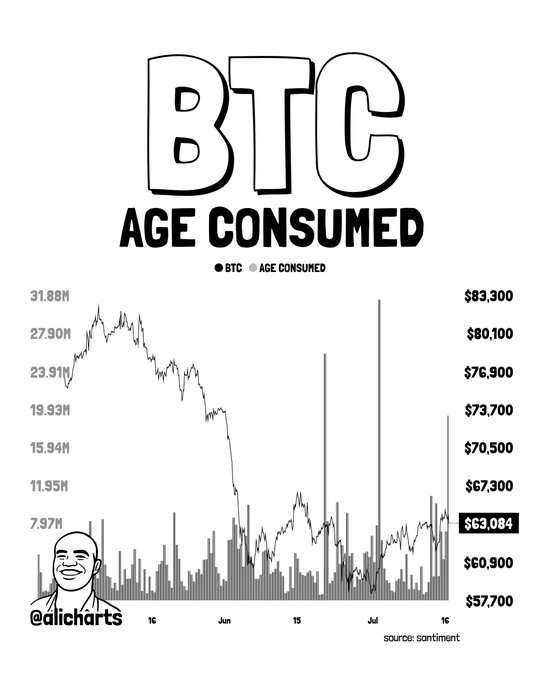
Age consumed is calculated by multiplying the number of coins moved by the amount of time those coins have remained inactive. A large reading therefore indicates that a relatively significant amount of previously dormant Bitcoin has changed addresses.
The metric does not reveal the intentions behind those transactions. Older holders could be transferring coins between their own wallets, moving funds to exchanges, redistributing holdings, or preparing to sell. Conversely, coins can also be moved as part of accumulation or custody changes.
That distinction is important when considering a Bitcoin price prediction today. The age-consumed spike should be viewed as a volatility signal rather than a direct bullish or bearish indicator.
Bitcoin’s recent market behavior reinforces that caution. The cryptocurrency climbed to approximately $65,500 on July 15 before pulling back toward $64,000 the following day. CoinDesk reported that profit-taking and geopolitical risk contributed to the retreat, while Bitcoin’s 30-day implied volatility stood near 38%.
The combination of dormant-coin activity and resistance near recent highs suggests that traders may be entering a more sensitive phase. However, the data alone does not establish the direction of the next major move.
Bitcoin Price Prediction: $65K-$66K Resistance Remains in Focus
The four-hour BTCUSD structure provides another important reference point for the current Bitcoin price prediction.
According to the technical setup outlined by ZenTrade_Setup, Bitcoin’s recent recovery followed a sharp decline that pushed price into the $58,250-$59,800 area. The rebound subsequently produced several Change of Character (CHoCH) and Break of Structure (BOS) signals, suggesting that short-term market structure had shifted in favor of buyers.
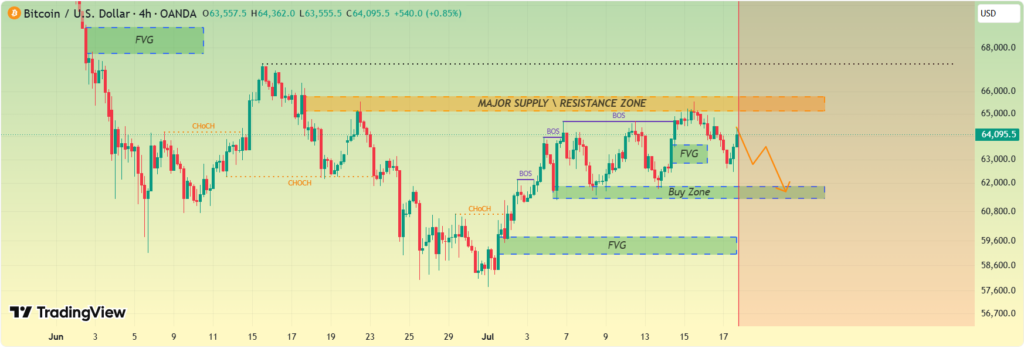
The recovery also left several Fair Value Gaps (FVGs), which are areas on a price chart where rapid movement created an imbalance between buyers and sellers. One of those gaps later acted as support as Bitcoin continued higher.
The rebound has now brought BTC price back toward a major supply area between approximately $65,000 and $66,000. This region previously limited upside during the middle of July and is therefore being watched as an important test for the recovery.
At around $64,095.50 in the referenced setup, Bitcoin was still below the upper boundary of that zone. A sustained move through $66,000 would provide stronger evidence that buyers are regaining control of the short-term structure. By contrast, repeated rejection from the area could leave the market vulnerable to a deeper retracement.
The technical setup identifies the $61,400-$62,200 region as a potential area of interest on a pullback. This zone overlaps with a recent FVG and earlier demand structure, making it a key level to monitor if Bitcoin fails to clear the $65,000-$66,000 resistance band.
Importantly, this is a technical scenario rather than a confirmed Bitcoin price forecast. Price action would need to validate either direction through a sustained breakout or a confirmed rejection.
Bitcoin BTC Technical Indicators Show a Neutral Market
TradingView’s BTCUSD technical data on Bitstamp presents a mixed picture. Bitcoin was recently trading around $64,124, with the overall technical summary rated neutral.
The composite reading included 7 sell signals, 8 neutral signals, and 11 buy signals across oscillators and moving averages. The balance indicates that short-term momentum has improved, but the broader trend has not yet shifted decisively upward.
The oscillator group was also neutral, with 1 sell signal, 7 neutral readings, and 3 buy signals.
The Relative Strength Index (RSI 14) stood at 53. This places Bitcoin close to the middle of the indicator’s typical range and suggests that momentum is neither strongly overbought nor oversold.
Other readings were similarly moderate. The Stochastic %K (14, 3, 3) was at 63, while the Commodity Channel Index (CCI 20) stood at 70. The Average Directional Index (ADX 14) was 24, pointing to relatively limited trend strength.
Several momentum indicators provided a more constructive signal. The Awesome Oscillator was at 1,327, Momentum (10) at 1,886, and MACD Level (12, 26) at 136, with each registering a buy signal in the referenced TradingView data.
However, Bull Bear Power at 878 generated a sell signal, while Stochastic RSI Fast, Williams %R, and the Ultimate Oscillator remained neutral.
Taken together, these readings suggest that the Bitcoin price today is supported by some short-term momentum but lacks the broad confirmation typically associated with a decisive breakout. This leaves room for consolidation or a pullback if buyers fail to overcome nearby resistance.
Moving Averages Highlight a Battle Between Short- and Long-Term Trends
The moving-average picture provides a more nuanced view of the current BTC price prediction.
TradingView’s moving-average analysis showed 8 buy signals, 6 sell signals, and 1 neutral reading. Shorter-term averages were generally supportive of the recovery.
The 10-period EMA stood near $63,753, while the 10-period SMA was around $63,857. Both generated buy signals with Bitcoin trading above these levels. The 20-period and 30-period moving averages also remained below the current market price, providing additional short-term support.
The 20-period Volume Weighted Moving Average (VWMA) was approximately $62,447 and also registered a buy signal.
Longer-term indicators, however, continued to present resistance.
The 50-period EMA was around $64,963 and carried a sell signal because Bitcoin remained below it. The 100-period EMA was significantly higher at approximately $68,205, while the 200-period SMA stood near $73,159.
The Hull Moving Average (9), at roughly $64,226, also showed a sell signal. Meanwhile, the Ichimoku Base Line was positioned near $61,626 and remained neutral.
This divergence between short- and long-term averages is important. Bitcoin has recovered above several near-term measures, but it continues to trade beneath key longer-term averages. As a result, the current structure resembles a short-term recovery within a broader corrective phase rather than a confirmed long-term trend reversal.
For the Bitcoin price prediction 2026, the ability to reclaim and hold above longer-term moving averages will therefore remain an important technical consideration. At present, the indicators do not provide enough evidence to establish a sustained bullish breakout.
Bitcoin Price Prediction Hinges on Key Support and Resistance Levels
Classic pivot levels offer additional reference points for the current market structure.
The central pivot was around $63,515, placing Bitcoin slightly above that level in the referenced technical snapshot. This area could act as an immediate gauge of short-term momentum.
The analysis placed the first major resistance level, R1, near $68,995, followed by R2 around $79,465 and R3 near $95,414.
On the downside, S1 was located around $53,046, while S2 stood near $47,566.
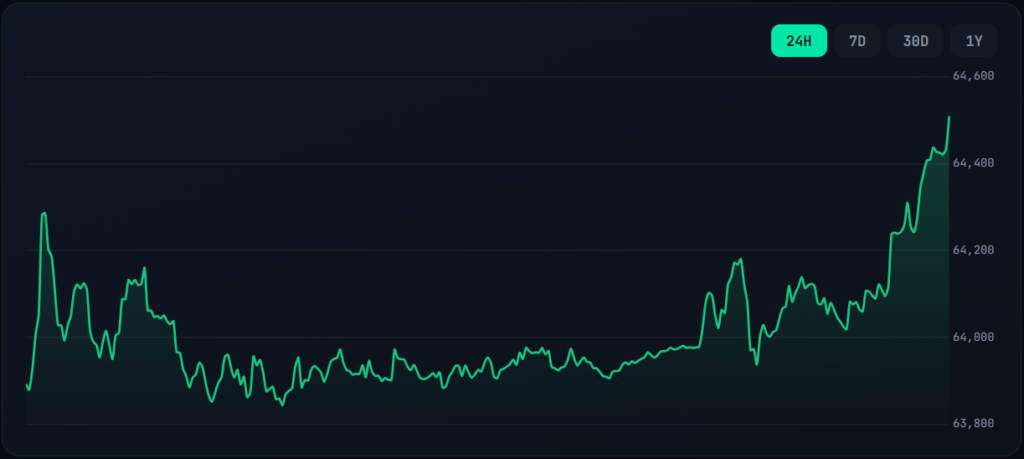
These pivot levels are considerably wider than the immediate trading range, illustrating the potential for larger price swings if Bitcoin eventually breaks out of its current consolidation structure.
In the nearer term, however, the $65,000-$66,000 supply zone remains the more immediate technical hurdle. A sustained move above $66,000 could strengthen the recovery structure and put higher resistance levels into focus.
Conversely, a rejection from that area could bring the $61,400-$62,200 region back into focus. A break below that area would weaken the short-term recovery and potentially expose Bitcoin to a broader retracement.
The $63,515 pivot also provides a useful intermediate reference. Holding above it could help preserve the current recovery structure, while sustained trading below it would indicate that sellers are gaining greater influence.
For now, the evidence supports a measured outlook rather than a definitive Bitcoin prediction. The age consumed spike warrants attention because it may coincide with greater market activity, but its directional implications remain unclear. At the same time, Bitcoin’s neutral technical profile leaves the market vulnerable to a breakout or pullback depending on how price responds to the $65,000-$66,000 resistance zone.
The immediate Bitcoin price prediction therefore remains centered on confirmation. Holding above short-term support while reclaiming $66,000 would strengthen the bullish case, whereas a sustained rejection and move toward the $61,400-$62,200 area would indicate that sellers are still capable of forcing a deeper correction.

Jack Spencer is a financial journalist and crypto market analyst covering digital assets, blockchain innovation, and global market developments. His reporting focuses on cryptocurrency price trends, regulation, institutional adoption, and the evolving digital asset ecosystem.
View all stories by Jack Spancer →
Responses
0