 BTC
 ETH
 USDT
 BNB
 USDC
 XRP
 SOL
 TRX
 FIGR_HELOC
 ZEC
 HYPE
 XMR
 DOGE
 USDS

Bitcoin (BTC) Price Prediction: Can Bulls Push BTC to $68.4K as the Ascending Channel Holds?
Bitcoin (BTC) continues to trade with a constructive short-term structure after breaking above the $65,500 resistance level, keeping the focus on whether buyers can extend the rally toward $68,415.


The latest Bitcoin price prediction comes as BTC maintains an ascending channel, supported by improving market sentiment, continued spot Bitcoin ETF inflows, and strengthening technical momentum.
The Bitcoin price recently climbed to around $66,639, according to TradingView data, posting a gain of approximately 2.2% on the session. Although the broader technical outlook remains mixed across longer timeframes, analysts say the near-term trend continues to favor buyers as long as newly established support levels remain intact.
Bitcoin Price Today: Ascending Channel Keeps Bulls in Control
The latest Bitcoin price action shows BTC trading within a well-defined ascending channel on the four-hour chart after clearing resistance near $65,500.
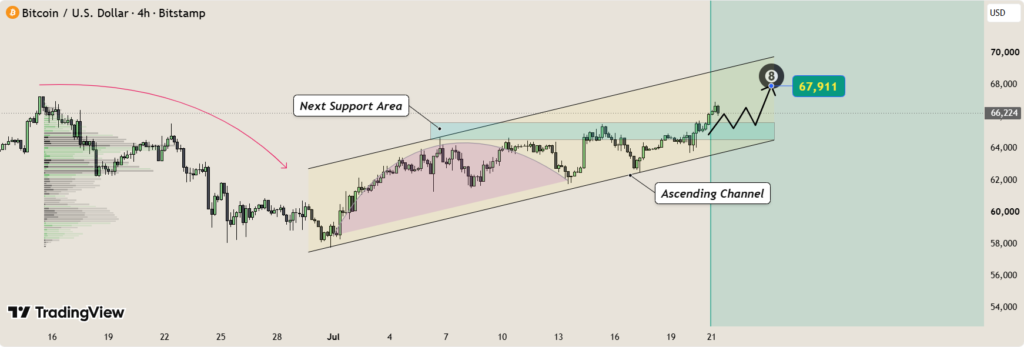
According to market analyst Swansense, the breakout has transformed the $64,600–$65,500 region into a key support zone.
“As long as the price holds the $64,600–$65,500 range, buyers maintain the advantage,” the analyst noted, adding that a successful retest followed by a close above $66,000 could pave the way toward a target of $67,911.
The higher-high, higher-low structure remains intact, suggesting that buying pressure continues to outweigh selling interest in the short term. However, confirmation above resistance is still required before the next leg higher can develop.
Bitcoin ETF Inflows Support the Recovery
Another analyst, Raekwon_fox, highlighted improving institutional participation as an additional tailwind for BTC.
The analysis noted that Bitcoin recently moved above a short-term peak while holding above a rising EMA cluster on the three-hour timeframe. The $64,600–$65,400 area has emerged as a support zone following the breakout.
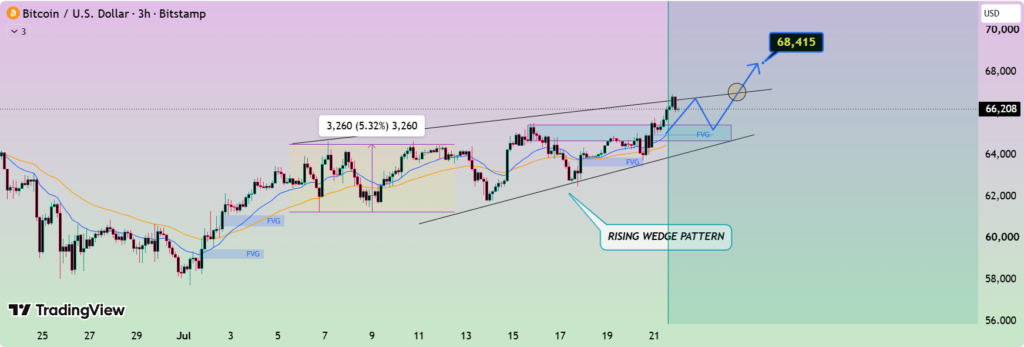
The analyst also pointed to approximately $110.3 million in net inflows into U.S. spot Bitcoin ETFs on July 20, reinforcing the view that institutional demand continues to support the market.
“A successful retest, followed by a close above $66,200, could pave the way for Bitcoin to test $67,000 before moving towards its main target at $68,415,” the analyst wrote.
Beyond ETF demand, broader market sentiment has improved as oil prices eased amid diplomatic expectations in the Middle East and Asian technology stocks recovered. Even so, elevated U.S. Treasury yields and a stronger U.S. dollar could continue to introduce short-term volatility.
Historical Macro Signal Draws Attention
While short-term charts remain constructive, analyst Ali Martinez (@ali_charts) highlighted a longer-term technical setup that has appeared only a handful of times during Bitcoin’s history.
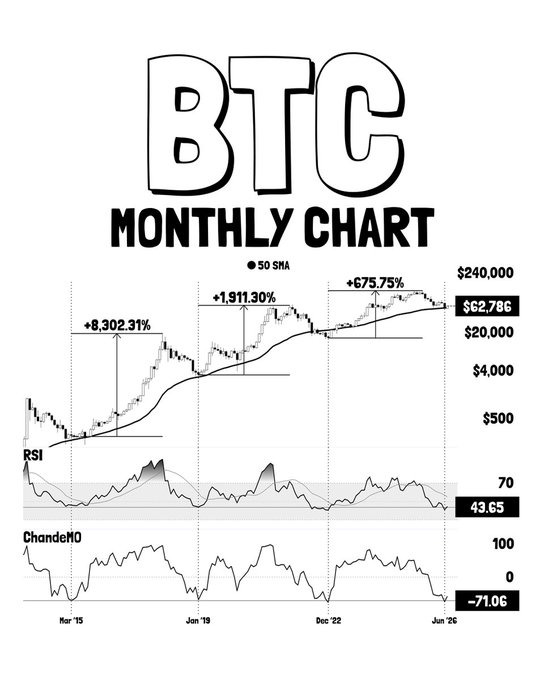
The monthly chart shows Bitcoin testing its 50-month moving average, while the Relative Strength Index (RSI) is near 43.65 and the Chande Momentum Oscillator (ChandeMO) is around -71.
According to Martinez, the same combination previously appeared during major market bottoms in March 2015, January 2019, and December 2022, each preceding significant multi-year rallies.
The analyst noted that Bitcoin’s recent correction toward $58,000 recreated the same technical pattern. At the same time, Martinez acknowledged that some on-chain metrics, including MVRV and CVDD, continue to suggest the possibility of additional downside toward the $40,000–$50,000 range. Instead of attempting to time short-term volatility, the analyst suggested focusing on gradual spot BTC accumulation.
Bitcoin Technical Analysis Shows Improving Momentum
TradingView’s latest technical overview presents a cautiously constructive outlook for Bitcoin despite maintaining an overall Neutral summary.
The RSI (14) stands at 62, indicating momentum remains positive without entering traditionally overbought territory.
Other momentum indicators also lean in favor of buyers:
- Average Directional Index (14): 21 (Buy)
- Awesome Oscillator: 1,922 (Buy)
- Momentum (10): 2,858 (Buy)
- MACD (12,26): 515 (Buy)
Meanwhile, Stochastic %K (88), Stochastic RSI Fast (95), CCI (20) at 199, Williams %R (-5) and the Ultimate Oscillator (62) all remain classified as neutral in the available data.
Overall, TradingView reports 0 Strong Sell, 7 Neutral, and 4 Buy signals among oscillators, reflecting improving momentum without signaling excessive market exuberance.
Moving Averages Continue to Favor Buyers
Moving averages present a stronger bullish bias than oscillators.
Short- and medium-term trend indicators, including the 10, 20 and 30-period EMAs and SMAs, all generate buy signals. Bitcoin is also trading above the EMA 10 (approximately $64,674), SMA 10 ($64,470) and EMA 50 (around $65,051), reinforcing the recent breakout.
However, longer-term averages remain overhead resistance. The EMA 100 (~$68,061), SMA 100 (~$70,170), EMA 200 (~$73,942) and SMA 200 (~$72,814) all continue to sit above the current Bitcoin price, indicating that the broader recovery remains incomplete.
TradingView’s moving-average summary currently consists of 10 Buy, 1 Neutral, and 4 Sell signals, highlighting the contrast between improving short-term momentum and lingering long-term resistance.
Additional reference levels include the Classic Pivot Point at approximately $63,515, R1 near $68,995, and S1 around $53,046.
Bitcoin Price Prediction
The short-term technical outlook remains constructive as long as Bitcoin continues to defend the $64,600–$65,500 support region.
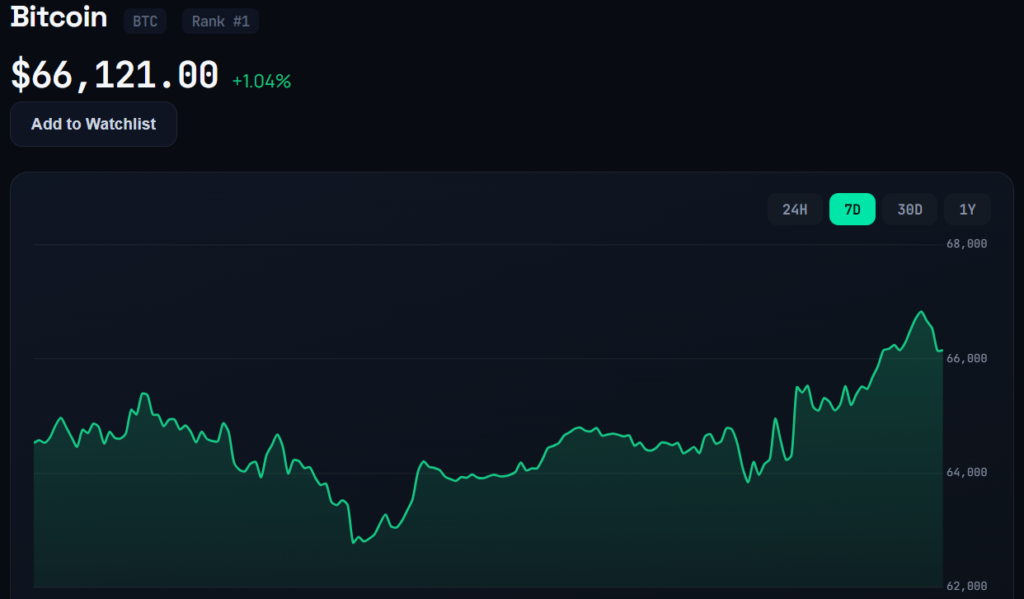
Holding above this range would preserve the ascending channel and keep immediate targets near $67,911 and $68,415 in focus. A sustained move through those levels could encourage traders to challenge the broader resistance area between $68,000 and $70,000, where several longer-term moving averages converge.
On the downside, failure to hold the breakout zone could expose the $63,000–$64,000 support area identified in TradingView’s technical analysis.
For now, the latest Bitcoin price forecast reflects improving momentum supported by bullish short-term moving averages, positive ETF demand and a well-defined ascending channel. However, longer-term resistance remains intact, suggesting that confirmation above the $68,000 region will be necessary before the broader trend can shift more decisively in favor of the bulls.

Jack Spencer is a financial journalist and crypto market analyst covering digital assets, blockchain innovation, and global market developments. His reporting focuses on cryptocurrency price trends, regulation, institutional adoption, and the evolving digital asset ecosystem.
View all stories by Jack Spancer →
Responses
0