 BTC
BTC  ETH
ETH  USDT
USDT  BNB
BNB  XRP
XRP  USDC
USDC  SOL
SOL  TRX
TRX  ZEC
ZEC  FIGR_HELOC
  HYPE
HYPE  DOGE
DOGE  XMR
XMR  WBT
WBT 
Zcash (ZEC) Price Prediction: Can the Bullish Trend Survive Growing Reversal Signals Above $1,200?
Zcash (ZEC) has extended one of its strongest rallies of 2026, climbing from below $400 to above $1,200. The advance has pushed the privacy-focused cryptocurrency into a technically stretched area.


While the broader Zcash price trend remains firmly positive, several momentum indicators are now flashing caution. A completed TD Sequential 9 setup on the three-day chart and a bearish divergence on the four-hour timeframe suggest that the rally could enter a consolidation or correction phase.
Zcash Rally Pushes Into an Extended Zone
ZEC was recently trading near $1,218.65 on Coinbase, according to the TradingView data referenced in the analysis. The move represents a substantial increase from the sub-$400 levels recorded earlier in the rally.

The speed of the advance is important when assessing the current Zcash price prediction. A market can remain above its moving averages and maintain a bullish structure while still becoming vulnerable to short-term profit-taking.
That appears to be the situation developing around Zcash. The token remains well above its principal trend averages, but several oscillators have moved into levels historically associated with stretched conditions.
Moving Averages Continue to Support Buyers
The strongest argument against an immediate bearish reversal comes from Zcash’s moving-average structure.
TradingView’s referenced data shows the 10-day EMA at $1,090.97 and the 20-day EMA at $961.50. The 30-day EMA stands at $873.55, while the 50-day EMA is considerably lower at $765.56.
The longer-term averages are even further below the current market price. The 100-day EMA is positioned at $638.90 and the 200-day EMA at $526.24. The corresponding SMA readings are $943.05, $679.55, $573.67, and $468.59 for the 20-, 50-, 100-, and 200-day periods.
The 20-day VWMA is also below spot at $951.25.
Taken together, these readings indicate that the larger trend has not yet lost its bullish structure. ZEC would need to fall substantially before challenging several of these longer-term trend indicators.
Momentum Indicators Tell a Different Story
The oscillator readings are considerably less optimistic.
The Relative Strength Index (RSI) at 75.84 is above the conventional 70 threshold and is classified as a sell signal in the referenced TradingView snapshot. The Commodity Channel Index (CCI) is also elevated at 135.08 and produces a sell reading.
Momentum stands at 370.90, while Williams %R is at -15.26. Both indicators also point toward selling pressure or an extended market.
Other measures remain more balanced. Stochastic %K is at 86.46, ADX at 59.51, Awesome Oscillator at 426.22, Stochastic RSI Fast at 51.31, Bull Bear Power at 368.42, and Ultimate Oscillator at 62.67. These readings were classified as neutral.
MACD provides the main bullish exception among the oscillator signals, with a reading of 155.89 and a buy classification.
As a result, the oscillator group contains four sell readings, six neutral readings, and one buy reading. That mix produces a neutral overall assessment rather than a confirmed bearish reversal.
TD Sequential Adds a Historical Warning
A separate technical warning comes from the three-day chart.
Market analyst @alicharts highlighted a completed TD Sequential sell setup with a count of 9 around $1,222. The signal emerged after ZEC’s rapid move from below $400, making the timing significant from a trend-exhaustion perspective.
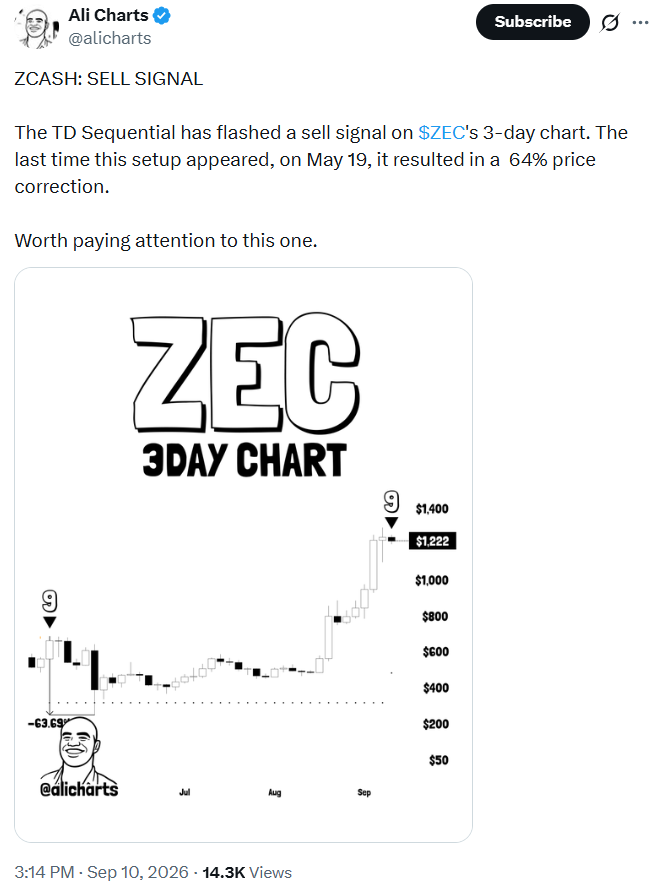
The TD Sequential is commonly used to identify potential exhaustion following a sustained directional move. A completed 9-count can therefore attract attention when the price has already advanced sharply.
The historical comparison is even more notable. A similar setup identified on May 19 was followed by a decline of approximately 64%, with the referenced chart showing a 63.69% drawdown.
That previous move should not be treated as a direct forecast for the current market. Technical patterns can produce very different outcomes depending on liquidity, momentum, and broader market conditions. Still, the historical reaction explains why the latest TD9 signal is receiving attention.
Four-Hour Divergence Raises Another Caution Flag
Shorter-term momentum is also showing signs of weakening.
TradingView analyst Cryptoraclero identified a bearish divergence on Zcash’s four-hour chart alongside a strong sell signal. The analysis points to previous instances in which similar conditions were followed by declines of approximately 9% and 20%.

The key confirmation level in that analysis is the rising trendline supporting the recent advance. A break beneath that structure, followed by a confirmed close below it, would provide stronger evidence that the short-term trend is changing.
Until that happens, the divergence remains a warning rather than proof of a reversal.
This distinction matters for the Zcash price prediction. Divergence can appear during strong bull markets and may result in consolidation rather than a sustained decline.
Bull Flag Keeps the Larger Breakout Structure Alive
There is also a bullish technical interpretation of the current ZEC chart.
TradingView analyst VincePrince argues that Zcash has completed a large descending-triangle formation and subsequently broken higher. The analysis identifies the breakout as part of a broader bullish structure, with Zcash holding above its exponential moving averages.

The chart also identifies a potential bull flag developing after the initial breakout. A move above the upper boundary of that formation could reinforce the continuation setup and open additional upside targets identified in the analysis.
This scenario would become more credible if ZEC continues to hold above its recently established breakout areas and momentum begins to recover.
Therefore, the current technical picture contains two competing signals. Short-term indicators are warning that the rally may be overextended, while the broader trend structure continues to favor buyers.
Key Zcash Support and Resistance Levels
Pivot calculations provide several levels that traders may monitor if volatility increases.
The classic pivot is positioned at $730.90. Above that level, the referenced resistance points are $1,004.42, $1,161.51, and $1,592.12. The corresponding downside levels include $573.81 and $300.29.
Fibonacci pivots place resistance at approximately $895.40, $997.02, and $1,161.51.
Several other pivot methodologies, including Camarilla, Woodie, and DeMark calculations, produce clusters around $886-$1,082 on the upside and approximately $631-$807 on the downside.
Some of these levels have already been surpassed during the latest rally. That changes their potential role. Former resistance can become support if buyers successfully defend the breakout.
The $1,161 area is particularly relevant because it appears as a resistance reference in both classic and Fibonacci calculations. Holding above this region could help maintain the current bullish structure, while a sustained move below it would increase the likelihood of a deeper retracement.
What the Current ZEC Price Prediction Shows
The latest indicators do not provide a simple bullish or bearish conclusion.
The long-term trend remains strong, with ZEC trading well above its major moving averages. The descending triangle breakout and potential bull flag also support the continuation case.
At the same time, the RSI above 75, elevated CCI, negative Williams %R signal, and completed TD Sequential 9 setup indicate that the market has become stretched after its rapid advance.
The four-hour bearish divergence adds another layer of caution. However, it requires price confirmation before it can be treated as evidence of a broader trend reversal.
For now, the $1,161-$1,222 area represents an important technical zone. Holding above the lower portion of that range could allow the broader bullish structure to remain intact. A decisive break below key trend support would make the corrective scenario more relevant.
Conversely, renewed strength above the recent highs could invalidate the immediate pullback thesis and put the bull-flag continuation setup back into focus.
The available technical evidence therefore points to a market at an important decision point rather than a confirmed reversal. Zcash’s longer-term structure remains constructive, but the strength of the recent rally has created conditions in which short-term volatility and profit-taking risks deserve close attention.

Jack Spencer is a financial journalist and crypto market analyst covering digital assets, blockchain innovation, and global market developments. His reporting focuses on cryptocurrency price trends, regulation, institutional adoption, and the evolving digital asset ecosystem.
View all stories by Jack Spancer →