 BTC
 ETH
 USDT
 BNB
 USDC
 XRP
 SOL
 TRX
 FIGR_HELOC
 ZEC
 HYPE
 XMR
 DOGE
 USDS

XRP Price Today: Short Sellers Retreat After FOMC as XRP Reclaims the $1.30 Zone
XRP is attempting to stabilize around $1.30 after a sharp retracement, with derivatives positioning showing signs that bearish bets are being reduced following the latest Federal Reserve decision.

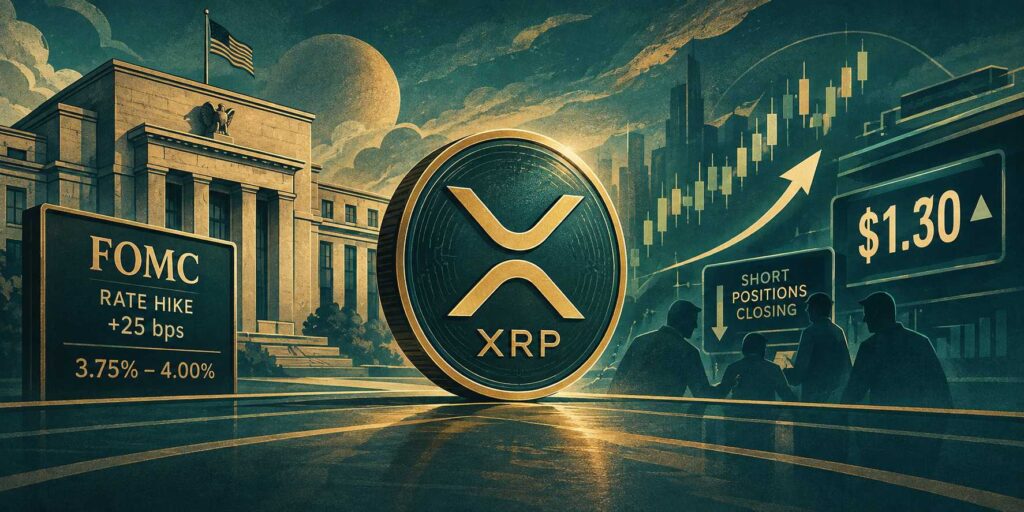
The September 16 FOMC meeting delivered a 25-basis-point rate increase, lifting the federal funds target range to 3.75%-4.00%. The move, the first rate hike since 2023, initially pressured risk assets as XRP investors assessed the prospect of tighter monetary policy lasting longer than previously expected.
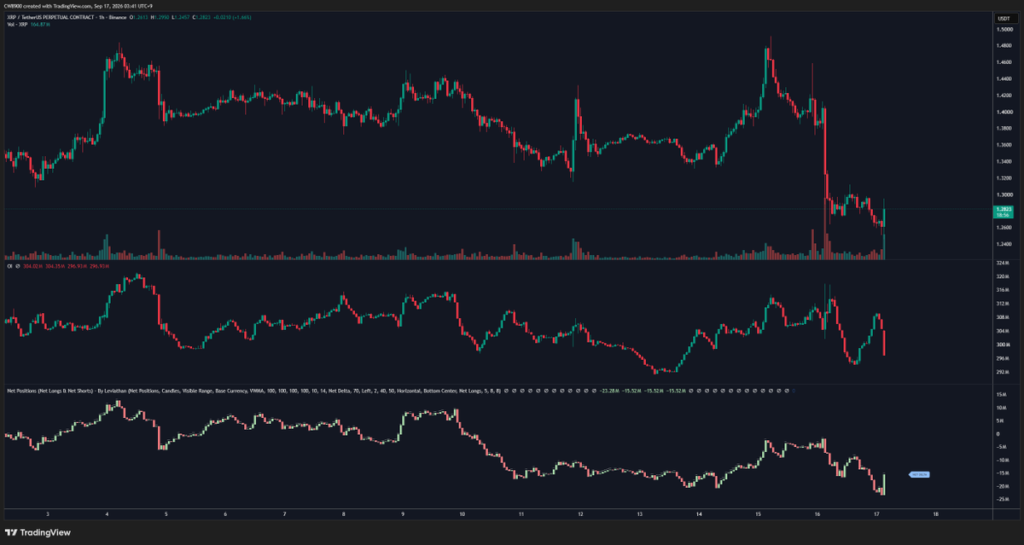
Yet XRP’s derivatives market has shown an important shift. Crypto analyst @CW8900 reported that short positions accumulated ahead of the FOMC meeting were being closed, potentially providing a source of buying pressure as traders exit bearish positions.
XRP Holds Near $1.30 After Sharp Retracement
The XRP price has recovered toward $1.30 after recent selling pushed the token substantially lower from its previous highs.
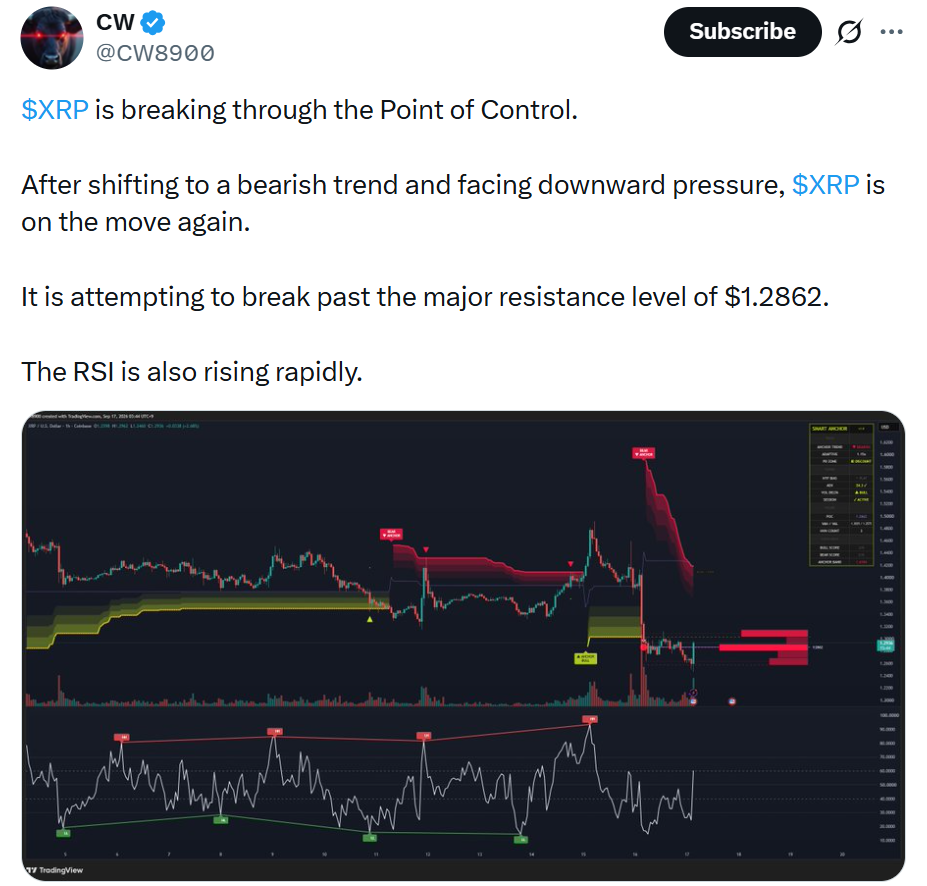
The rebound is developing at a technically important area. According to analysis shared by @CW8900, XRP is testing a Point of Control around $1.2862. The level had previously attracted substantial trading activity and subsequently acted as resistance when the market weakened.
A Point of Control represents the price within a selected volume profile where the greatest amount of trading occurred. Regaining such a level can provide useful information about where market participants have previously shown significant interest.
The latest chart also shows the RSI turning higher. However, the indicator remains below the midpoint, suggesting that momentum has improved from recent weakness without yet producing a strong bullish signal.
That distinction is important when assessing the XRP price prediction. Short covering can accelerate a recovery, but it does not necessarily indicate that a new sustained uptrend has already been established.
Fed Decision Adds a Macro Test for XRP
The Federal Reserve’s latest decision has complicated the outlook for cryptocurrencies.
The central bank raised rates to 3.75%-4.00% and maintained its focus on inflation. Fed Chair Kevin Warsh said inflation remained “too high,” while policymakers continued to monitor economic activity and price pressures.
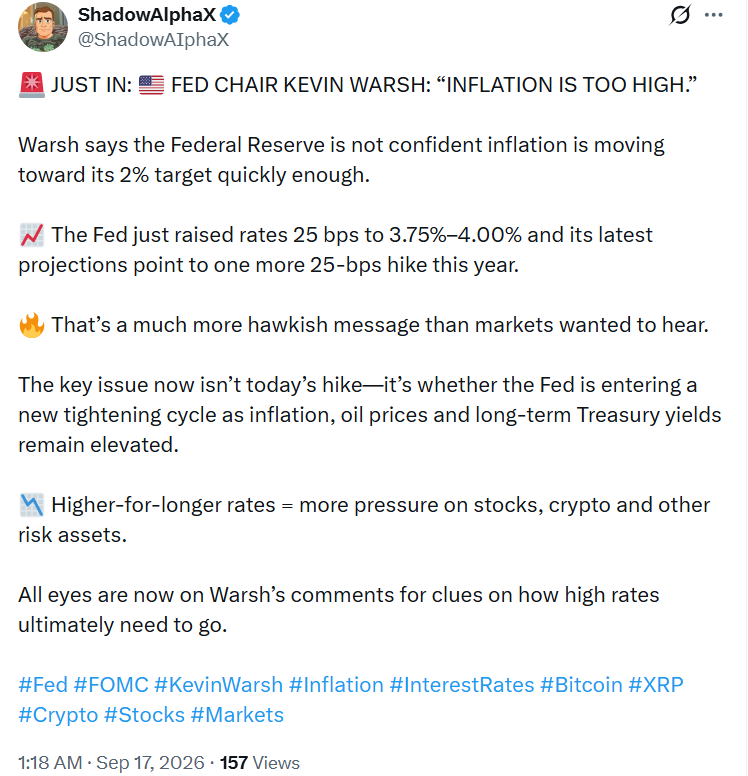
Fed Chair Kevin Warsh said “inflation is too high,” adding that the Federal Reserve is not confident inflation is moving toward its 2% target quickly enough. Source: @ShadowAIphaX/X
The updated projections also point toward another possible rate increase during 2026. The Fed’s median projection for the federal funds rate at the end of the year rose to 4.1%, compared with 3.6% in its June projections.
That policy stance triggered an immediate reaction across financial markets. U.S. stocks declined while Treasury yields moved higher, reflecting renewed concern about restrictive monetary conditions.
For XRP today, the significance is broader than the FOMC decision itself. Cryptocurrency prices remain sensitive to changes in liquidity, bond yields and overall appetite for risk. A higher-for-longer interest-rate environment can therefore create headwinds even when individual tokens show signs of technical recovery.
$1.2862 Volume Level Could Define the Near-Term Structure
The immediate technical battle is taking place close to $1.29.
XRP’s attempt to reclaim the $1.2862 Point of Control follows a period in which the token lost several short-term support levels. The recovery therefore needs to be assessed against the previous breakdown rather than viewed in isolation.
TradingView’s technical summary remains mixed. The aggregated indicators show 13 sell readings, 10 neutral readings, and three buy signals.
The moving-average component is particularly cautious. Shorter-term averages continue to sit above the current XRP price, with the 10-period EMA around $1.345 and the 20-period EMA near $1.347. The 30-period EMA is approximately $1.325.
These levels create a resistance band above the current market price.
Momentum indicators are less decisive. The 14-period RSI is around 43.82, while the Stochastic %K is approximately 24.19. Both remain within neutral territory under TradingView’s classification.
Meanwhile, MACD and 10-period Momentum continue to produce sell signals.
The combination suggests that XRP has improved from its recent lows but has not yet generated broad confirmation across the technical indicators.
$1.35 Emerges as the Bigger Resistance Zone
A recovery above $1.30 would not immediately remove the technical challenges facing XRP.
TradingView’s classic and Fibonacci pivot calculations put the central pivot at approximately $1.354. That level sits close to several short-term moving averages, making the $1.32-$1.35 region an important area for the market.
A sustained recovery through this zone would place additional resistance levels on the chart. The Camarilla system identifies levels around $1.445, $1.510, and $1.575, while the Fibonacci calculation puts its first resistance at approximately $1.626.
On the other hand, a failure to maintain the recent recovery could expose lower support references. Camarilla support levels appear near $1.314, $1.249, and $1.184.
These calculations should be treated as technical reference points rather than predetermined XRP price targets. Their relevance can change as market structure and trading volume develop.
Three-Month Chart Keeps $1 in Focus
While short-term traders are watching $1.29-$1.35, the higher-timeframe chart presents a different reference point.
A three-month technical analysis shared on September 16 identifies the $1 psychological level as an area where several structural signals converge. These include three-month support, a swept low, a previously broken high, and an engulfing candle close.
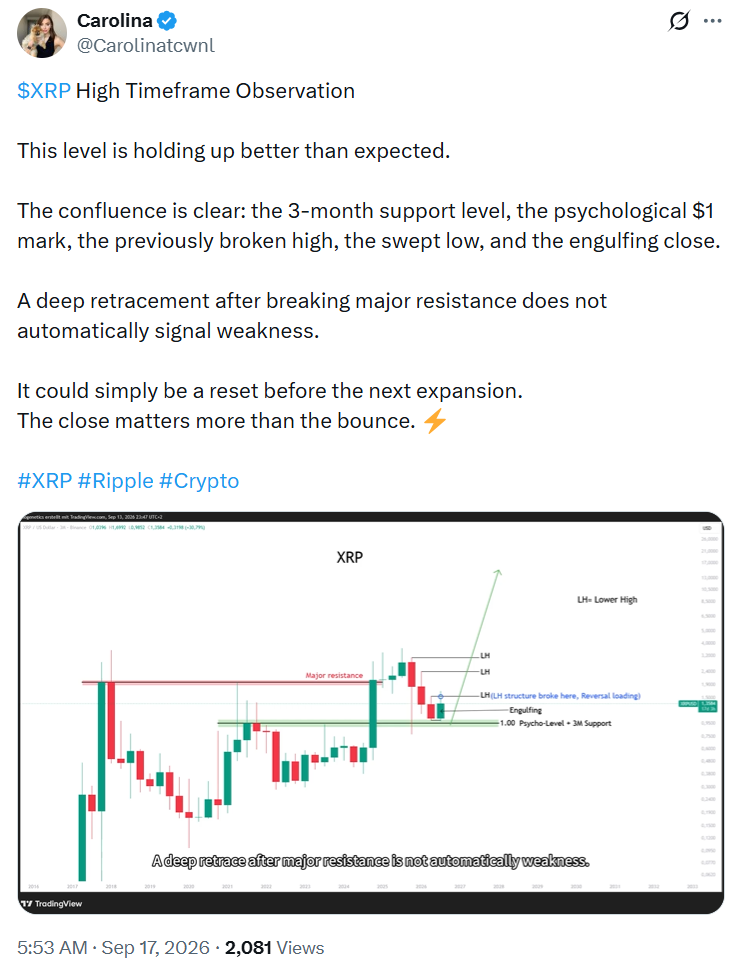
The analysis places greater emphasis on the eventual higher-timeframe candle close than on an isolated intraday bounce.
That approach is particularly relevant following XRP’s recent retracement. A sharp decline can alter short-term momentum without necessarily determining the direction of a larger market structure.
XRP previously fell below $1 in August. CoinDesk reported that the token briefly traded near $0.98 on August 18, its lowest level since November 2024, before recovering.
Consequently, the $1 region remains a significant historical reference for the XRP price chart, while $1.30 represents a much closer level for current market structure.
What the Latest XRP Setup Shows
The current setup contains several competing signals.
On the derivatives side, the reported reduction in XRP short positions indicates that some traders are closing bearish exposure after the FOMC event. Such activity can contribute to upward price pressure because traders must buy XRP or related contracts to close short positions.
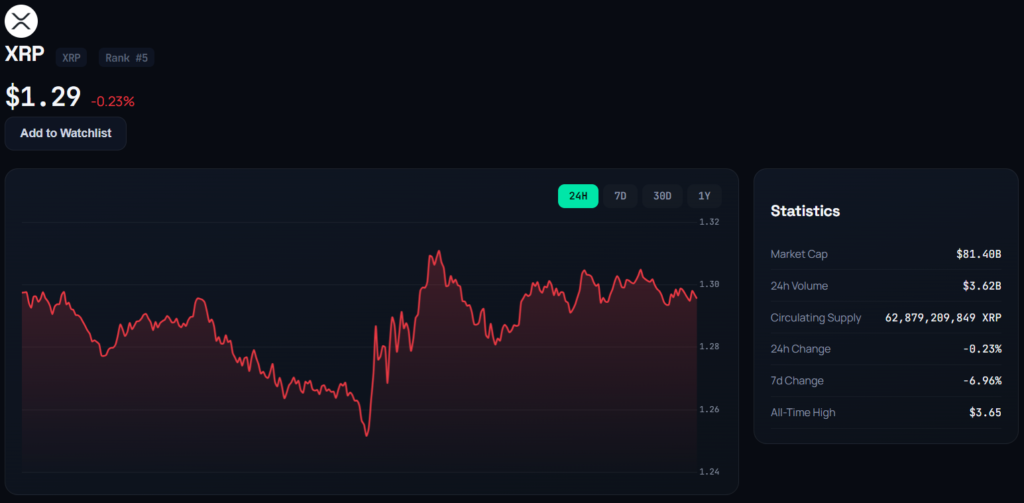
Technical momentum has also improved from the recent decline, with RSI moving higher and XRP attempting to regain the $1.2862 volume-profile level.
However, the broader indicator picture remains cautious. Most shorter-term moving averages are still above the market, while MACD and Momentum continue to register sell signals.
The Federal Reserve’s latest rate increase adds another constraint. With policymakers signaling that inflation remains above target and leaving room for another increase, the macro environment is not providing an obvious liquidity tailwind for cryptocurrencies.
XRP Price Outlook Depends on $1.30 Follow-Through
The next stage of the XRP price prediction will largely depend on whether the recent recovery develops beyond short covering.
Holding around $1.30 would keep the token above the nearby Point of Control and could allow traders to focus on the $1.32-$1.35 resistance cluster. The central pivot near $1.354 represents another important technical reference.
Failure to sustain the recovery, meanwhile, would put the $1.249 Camarilla support level on the radar, followed by lower reference points around $1.184.
The distinction between a positioning-driven rebound and a broader trend change will therefore remain important. Closing short positions can generate a rapid bounce, but additional evidence from price structure, volume, and momentum would be needed to establish whether buyers are gaining lasting control.
For now, XRP remains caught between improving derivatives positioning and a still-cautious technical backdrop. The token’s ability to remain above the $1.30 area while confronting resistance near $1.35 could provide a clearer indication of how the market is absorbing the latest FOMC shock.

Julia Thornton is a cryptocurrency reporter covering blockchain, digital assets, and financial technology. She reports on market developments, regulation, exchange activity, and industry trends, delivering timely and accurate coverage of the global crypto ecosystem.
View all stories by Julia Thornton →