 BTC
 ETH
 USDT
 BNB
 USDC
 XRP
 SOL
 TRX
 FIGR_HELOC
 ZEC
 HYPE
 XMR
 DOGE
 USDS

XRP Price Prediction: $1.40 Breakout Test Could Decide Whether Bulls Can Retest $1.54 Resistance
XRP is entering September with traders focused on a narrow technical range that could determine the direction of its next major move.

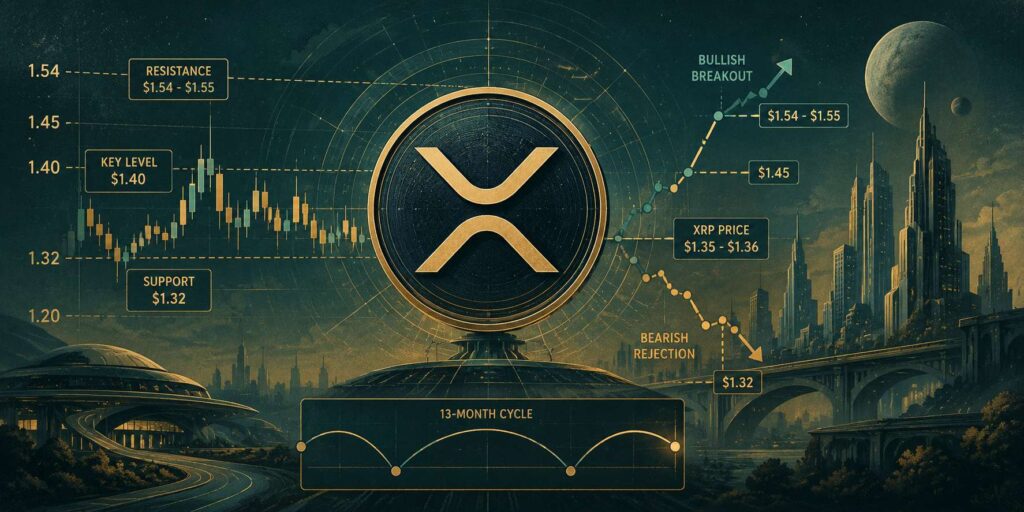
The XRP price has been hovering around $1.35-$1.36, leaving it close to several important support and resistance levels as volatility contracts.
The immediate question is whether XRP can reclaim the $1.40 area and establish a stronger recovery structure. A successful breakout could bring $1.45 and the $1.54-$1.55 region into focus. On the other hand, continued rejection below resistance could send the cryptocurrency back toward $1.32 or lower.
The longer-term picture is more constructive. A TradingView analysis by Fractical points to a recurring 13-month cycle and argues that XRP’s latest decline may have completed an important bottoming phase. However, other technical readings remain cautious, meaning the market has yet to confirm that interpretation.
XRP Enters a Compression Phase
The XRP price has been moving within a relatively tight range after failing to sustain its previous recovery. That consolidation has created a more important battleground between roughly $1.32 and $1.40.
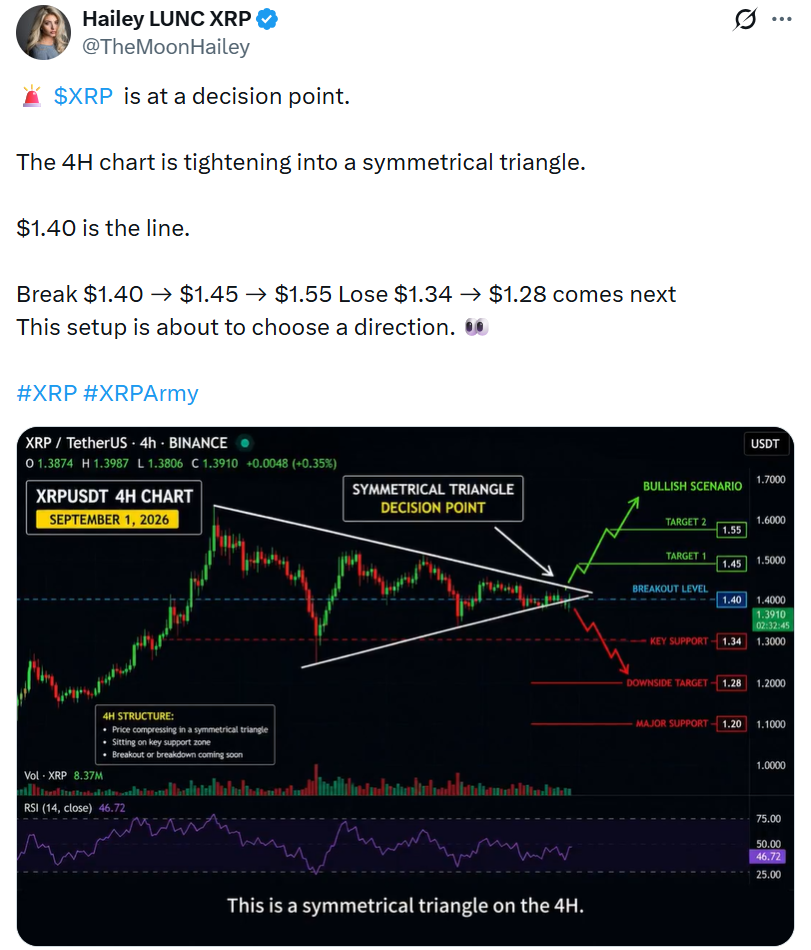
An analysis shared by @TheMoonHailey identified a symmetrical triangle on the four-hour chart. XRP was approaching the apex of the formation near the beginning of September, suggesting that the period of declining volatility may eventually give way to a larger move.
The analyst highlighted $1.40 as the key upside trigger. A break above that level could expose XRP to approximately $1.45, followed by $1.55.
The downside levels are equally important. A failure to hold the lower part of the pattern could bring $1.34 into play, while a deeper decline could expose $1.28.
This makes the current XRP price prediction less about forecasting an immediate rally and more about identifying which side of the range ultimately gains control.
A Different View Emerges From XRP’s Long-Term Cycle
While the short-term chart remains undecided, Fractical’s analysis takes a much longer view.
The TradingView analyst recently published a chart based on what they describe as an approximately 13-month cycle in XRP. The analysis was originally prepared in February but was published later after the latest market developments.
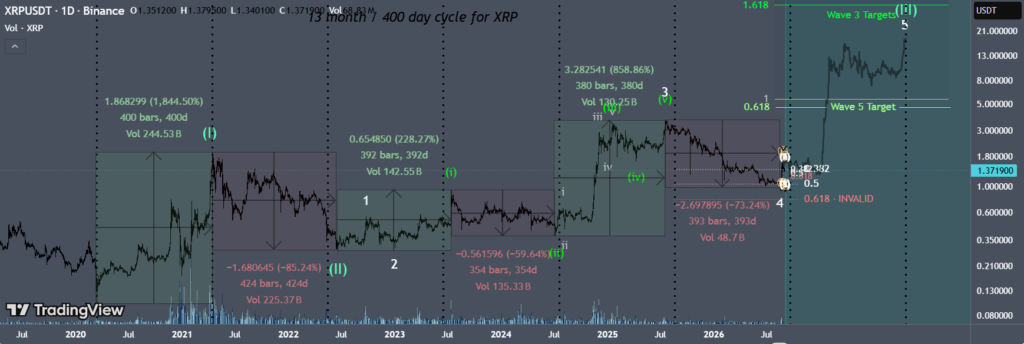
Fractical noted that historical XRP highs and lows had tended to occur close to the cycle markers. In the analyst’s interpretation, the latest bearish swing low also arrived shortly before the latest marker.
That timing forms the foundation of the bullish thesis.
Fractical wrote that the “bottom structure is complete” and is now looking for a five-wave impulsive move higher over the new cycle.
If that interpretation proves correct, the price could enter an extended accumulation-to-expansion phase rather than simply producing a short-lived rebound. The proposed structure would follow the conventional Elliott Wave sequence of advancing and corrective waves.
Still, cycle analysis is inherently interpretive. Previous turning points occurring near selected time markers do not guarantee that future pivots will follow the same schedule. The wave count can also change as market conditions develop.
The $1.54 Level Becomes the Bigger Test
The XRP price forecast 2026 becomes more significant above the immediate $1.40 resistance because the next major hurdle sits considerably higher.
ChartNerdTA identified the daily 20 EMA around $1.31-$1.32 as an important support area. As long as the price remains above that region, the analyst sees room for a recovery toward the 50-week EMA near $1.54.
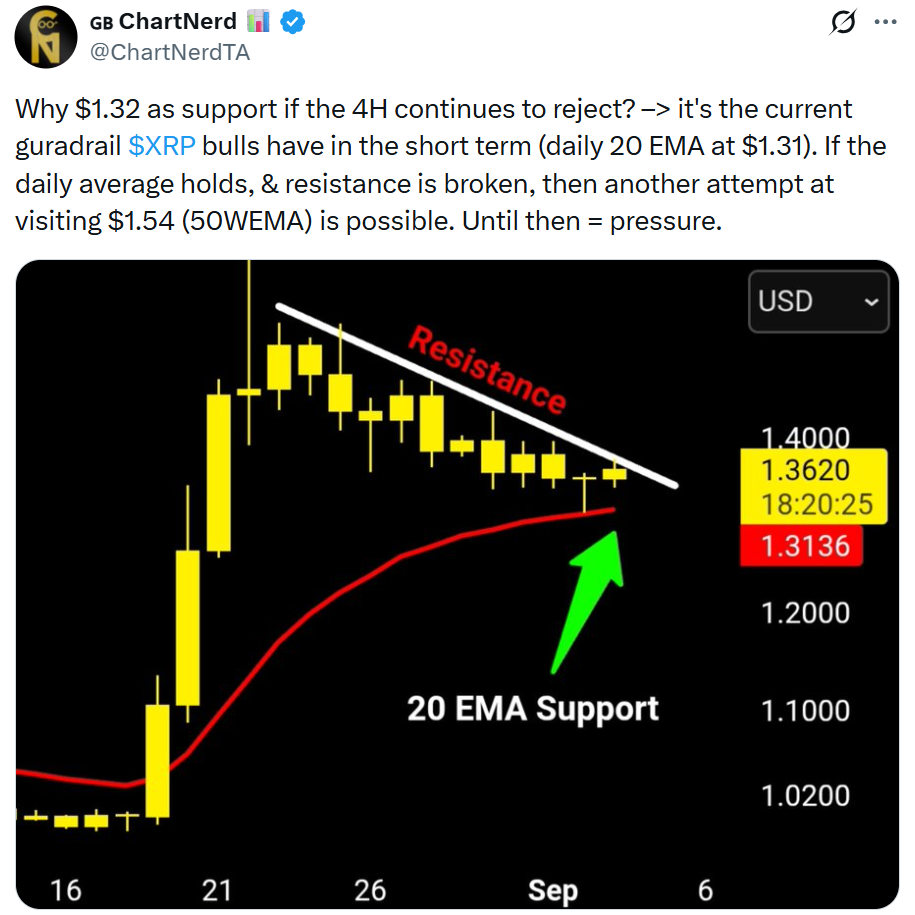
That weekly moving average could become a major test for any sustained bullish reversal.
Unlike a short-term resistance level, the 50-week EMA reflects a broader trend and can carry greater significance for traders assessing whether a recovery is developing into a larger trend change.
Consequently, a move toward $1.54 would represent more than another short-term bounce. XRP would need to clear several intermediate barriers before reaching that level, and a sustained move beyond it would provide stronger technical confirmation of improving momentum.
Four-Hour Structure Still Favors Caution
The bullish long-term thesis is not yet fully supported by XRP’s shorter-term price structure.
A TradingView analysis recently pointed to a bearish break of structure at $1.3352 on the four-hour chart. The price subsequently recovered, but the rebound was still trading around the area of the EMA21 and EMA55.
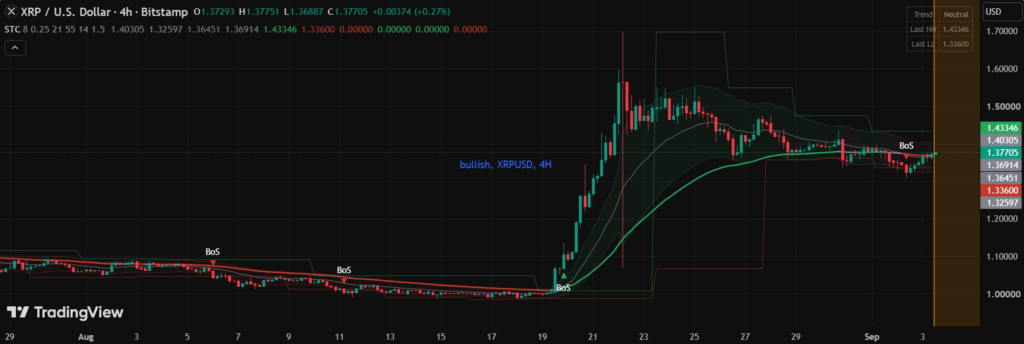
The analysis placed the EMA21 at approximately $1.3655 and the EMA55 near $1.3697.
For the recovery scenario to gain credibility, the analyst wants to see XRP reclaim the EMA55 and then push through $1.3810. Such a move could shift attention toward $1.4045 and the previous swing high near $1.4335.
Failure to hold the EMA cluster would tell a different story.
A move below $1.3655 could leave the market exposed to the lower part of the volatility range near $1.3265. A four-hour close below that level would weaken the recovery setup and suggest that the bearish break of structure remains active.
The conflicting signals are important. The long-term cycle analysis is bullish, but the four-hour structure still requires confirmation.
Exchange Supply Adds Another Layer to the XRP Outlook
Technical indicators are not the only data attracting attention.
CryptoQuant data cited in recent market analysis shows that XRP reserves on Binance have declined substantially over the past year. Monthly average reserves reportedly fell from about 3.1 billion XRP in November 2025 to around 2.6 billion currently, bringing exchange-held supply to its lowest level since February 2024.
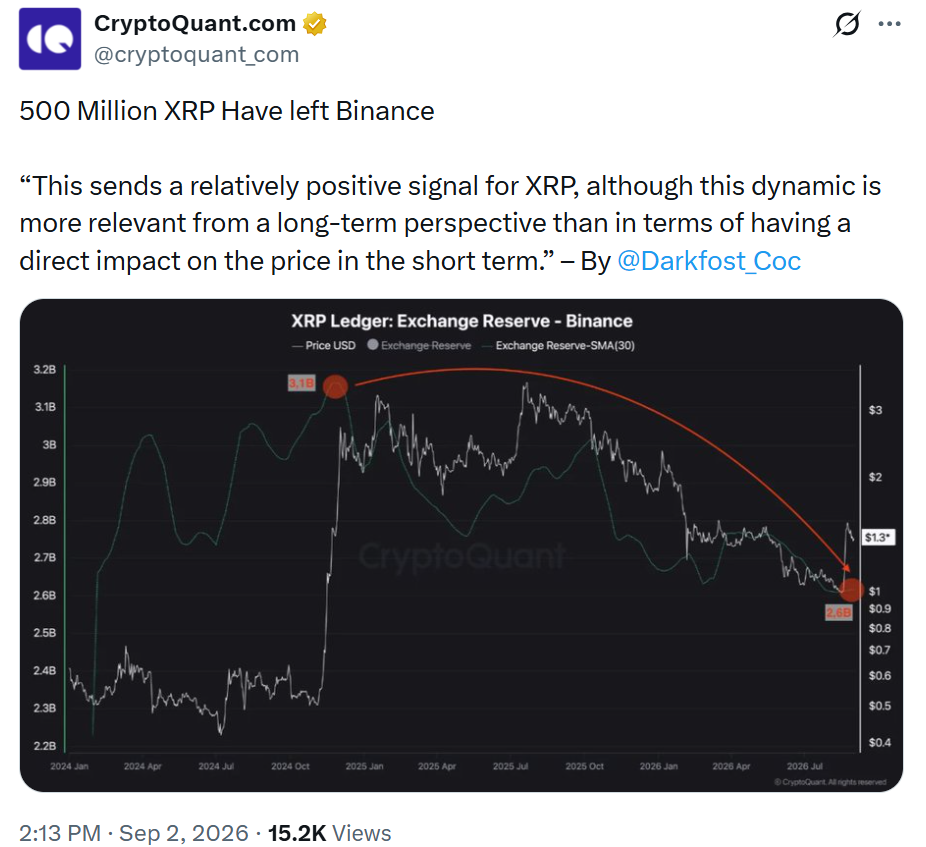
The decline amounts to roughly 500 million XRP leaving Binance over the period.
Exchange balances can provide useful context when assessing market positioning. A persistent reduction may indicate that some holders are transferring tokens away from trading venues and into private wallets or longer-term custody.
However, declining exchange reserves should not automatically be interpreted as a bullish price signal. Wallet movements can have multiple explanations, including custody changes and internal transfers.
The reserve trend therefore supports the broader discussion around XRP supply dynamics but does not independently confirm the 13-month bottom thesis.
XRP Bulls Need More Than a Cycle Signal
The most important part of the current XRP price prediction is confirmation.
A sustained move through $1.40 would strengthen the immediate bullish setup and potentially open the path toward $1.45. Beyond that, the $1.54-$1.55 region becomes the next major area to watch.
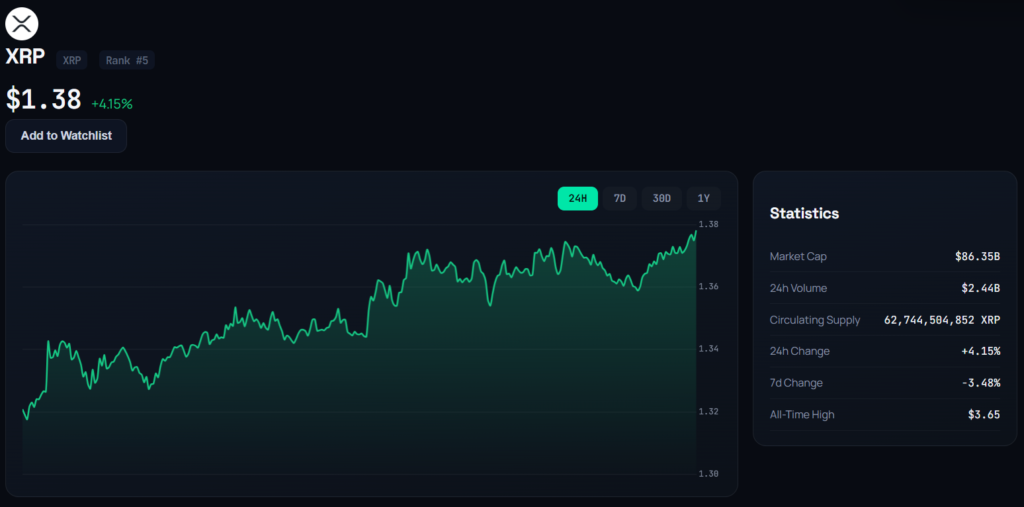
A breakout above $1.40 would also help resolve the symmetrical triangle that has been developing on the four-hour chart.
Conversely, repeated rejection below $1.40 would keep the price trapped within its current range. A decline through $1.34 could expose the $1.32 region, while a deeper breakdown toward $1.28 would put greater pressure on the argument that a durable bottom has already formed.
For the longer-term thesis to gain credibility, XRP would eventually need to demonstrate a sequence of higher highs and higher lows rather than relying solely on historical cycle timing.
The Next XRP Move Could Define the Setup
XRP is currently caught between two competing narratives.
One points to a potentially completed long-term bottom, supported by a recurring 13-month cycle and the prospect of a new five-wave advance. The other highlights unresolved short-term weakness, with XRP still needing to reclaim key moving averages and resistance levels.
That leaves $1.40 as an important near-term reference point and $1.54 as a larger test for the broader recovery.
If buyers can establish support above $1.40 and maintain upward momentum, the technical picture would become increasingly constructive. A later break above $1.54 would provide an even stronger signal that XRP’s broader trend is changing.
Until those levels are reclaimed, however, the 13-month cycle remains an analyst hypothesis rather than confirmation of a new bull phase. For now, traders are likely to watch the $1.32-$1.40 range closely for evidence of which scenario is beginning to play out.

Jack Spencer is a financial journalist and crypto market analyst covering digital assets, blockchain innovation, and global market developments. His reporting focuses on cryptocurrency price trends, regulation, institutional adoption, and the evolving digital asset ecosystem.
View all stories by Jack Spancer →