 BTC
BTC  ETH
ETH  USDT
USDT  BNB
BNB  XRP
XRP  USDC
USDC  SOL
SOL  TRX
TRX  FIGR_HELOC
  ZEC
ZEC  HYPE
HYPE  DOGE
DOGE  XMR
XMR  USDS
USDS 
XRP Price Today: XRP Holds Near $1 as Bearish Sentiment Clashes With Rising XRPL Activity
XRP price action remains under pressure on August 18 as the cryptocurrency continues to trade around the psychologically important $1 level.

The recent decline has weakened market sentiment, but activity on the XRP Ledger has moved in the opposite direction, creating a notable divergence between price and network participation.
The latest TradingView technical data also point to a cautious market structure. XRP/USD is trading around the $1.00-$1.01 area, while moving averages continue to signal selling pressure. At the same time, several momentum indicators remain neutral, suggesting that the market has yet to develop a strong directional move.
XRP Price Today: $1 Remains the Key Battleground
The XRP price has repeatedly tested the $1 area after falling below the level earlier this month. Recent market data cited by Brave New Coin showed XRP/USD around $1.0026, while the token has continued to fluctuate close to the round-number support.
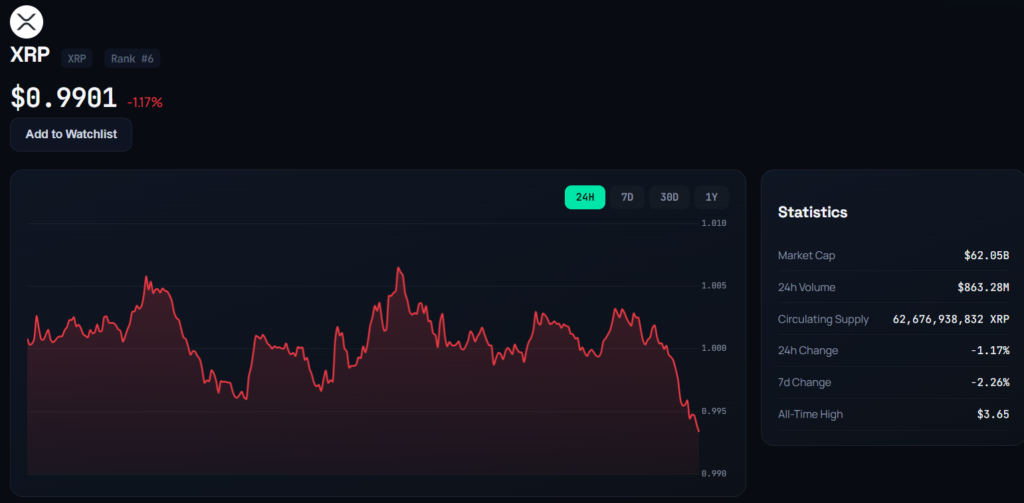
The $1 threshold has become important for both technical and psychological reasons. A sustained hold above it would keep the recent consolidation intact, while another decisive move below the level could expose lower support areas.
TradingView-based analysis places immediate resistance around $1.01-$1.02. Above that zone, the next significant area appears between $1.04 and $1.10. On the downside, support is concentrated near $1, with additional technical levels around $0.9760-$0.98.
This leaves the current XRP price in a relatively narrow decision zone. Buyers need to regain ground above the nearby moving averages, while sellers remain in control as long as rebounds fail below those levels.
Technical Indicators Keep XRP Price Under Pressure
The broader XRP chart remains bearish despite some signs that selling momentum has moderated.
TradingView’s moving-average readings show a strong sell bias. Shorter-term averages, including the 21 EMA around $1.0087 and the 55 EMA near $1.0236, are positioned above the current market price. These levels can act as resistance when the price attempts to recover.
Longer-term averages are also above spot levels, reinforcing the broader downward trend. The 50-day SMA is around $1.0011, while other major simple and exponential moving averages remain higher.
The oscillator picture is less decisive. XRP’s 14-day RSI is around 52.96, placing it close to the middle of its range rather than in an overbought or oversold zone. The Stochastic RSI is near 48.86, while the CCI is around 16.52.
The ADX, at roughly 20.17, points to relatively weak trend strength. Meanwhile, the MACD is close to zero. Together, these readings suggest that momentum has not yet developed enough to confirm a major shift in direction.
In other words, the XRP chart is bearish from a trend perspective, but momentum indicators do not currently show an extreme selling condition.
XRP Ledger Activity Surges as Sentiment Turns Bearish
The most notable development in XRP news today is the growing gap between social sentiment and blockchain activity.
Santiment reported that XRP-related commentary across X, Reddit, Telegram, and other crypto communities had reached a three-month bearish extreme. The shift came as the token struggled to regain the $1 level.
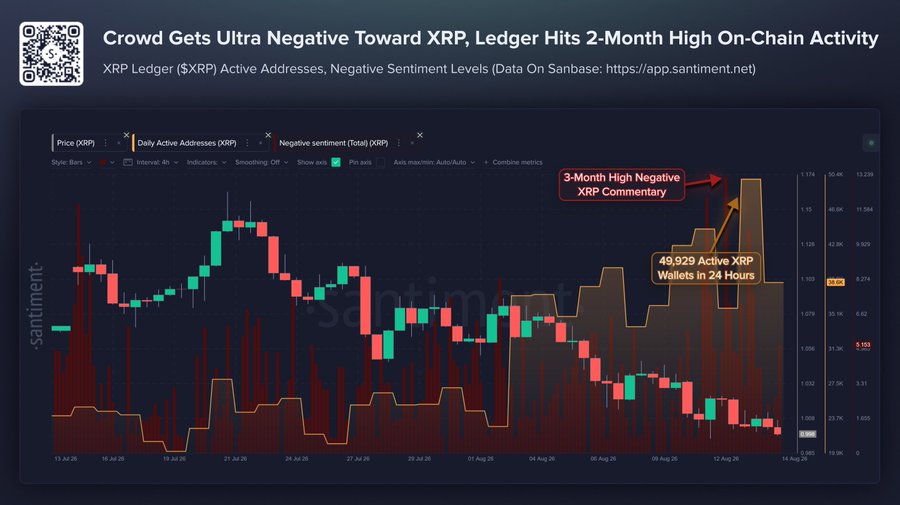
At the same time, the XRP Ledger recorded 49,929 active addresses over a 24-hour period on August 14, its highest reading in more than two months.
Santiment described the contrast directly, noting that “XRP negativity surged” while the XRP Ledger was showing substantially higher activity.
The increase in active addresses does not necessarily mean investors are accumulating XRP. The metric counts addresses involved in transfers and can rise because of buying, selling, exchange movements, or other network activity.
Still, the figure indicates that blockchain participation has not declined in line with the deterioration in market sentiment. That makes the current XRP price setup more complex than the chart alone suggests.
XRP’s Fundamentals Remain a Mixed Picture
The broader Ripple XRP story has also evolved considerably over the years. The XRP Ledger remains an established blockchain focused on fast settlement and low transaction costs, while Ripple has expanded its institutional payments and financial infrastructure.
However, growth in Ripple’s business does not automatically translate into equivalent demand for XRP.
This distinction remains important when assessing the current XRP value. Institutions can use Ripple’s broader technology and payment infrastructure without necessarily requiring XRP for every transaction.
The same issue applies to activity on the XRP Ledger. Higher transaction counts or more active addresses demonstrate network usage, but they do not, by themselves, establish that demand for the token as an asset is increasing at the same rate.
That helps explain why stronger infrastructure and network activity can coexist with a weak XRP price.
RLUSD Adds Another Layer to the XRP Story
Ripple’s RLUSD stablecoin has also added a new dimension to the ecosystem.
A dollar-denominated stablecoin can potentially support payments, settlement, and other financial applications without exposing users to the price volatility associated with XRP. That could encourage broader activity across Ripple’s ecosystem, but it also raises questions about how much additional demand that activity creates for XRP itself.
The distinction matters because XRP’s investment case depends not only on the growth of Ripple or the XRP Ledger, but also on whether that growth translates into sustained demand for the native token.
For now, the relationship remains difficult to quantify from price action alone.
XRP Faces a Competitive Payments Market
XRP also operates in an increasingly competitive digital payments environment.
Stablecoins such as USDT and USDC provide alternative settlement mechanisms, while traditional financial networks, tokenized deposits, and blockchain-based payment systems continue to develop.
The XRP Ledger’s speed and low transaction costs remain important characteristics, but competing networks can offer similar advantages in different forms.
This means the key issue is not simply whether the technology works. It is whether real-world adoption produces enough direct demand for the token to materially affect its market value.
Current network data provide evidence of activity, but they do not yet establish that such a structural change has occurred.
What the XRP Chart Shows Right Now
From a price perspective, XRP remains inside a broader descending structure. The immediate pivot is around $1.0023, while resistance is concentrated between $1.01 and $1.02.
A move above that area would put the short-term moving averages back under pressure and could open the way toward $1.04. The broader resistance zone between $1.04 and $1.10 remains more significant because it has acted as an overhead barrier during recent trading.
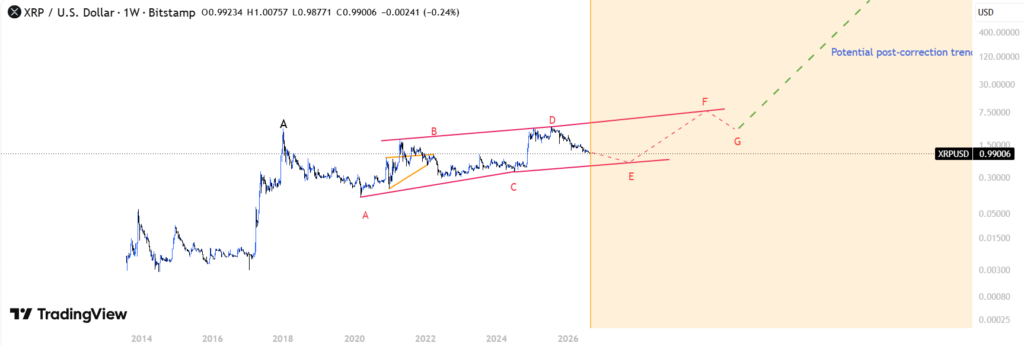
On the downside, $1 is the first level to watch. A sustained break could bring the $0.9760-$0.98 region into focus. Below that, technical support extends toward approximately $0.93.
These levels are more useful for describing the current market structure than for establishing a fixed XRP price prediction. The immediate question is whether buyers can defend the $1 area and reclaim nearby resistance, rather than how far the price could move over the longer term.
The Bigger Picture for XRP
The current XRP price reflects a market caught between improving network participation and weak investor confidence.
The surge to nearly 50,000 active XRPL addresses is notable, particularly because it occurred while social sentiment was at a three-month bearish extreme. However, higher activity alone cannot confirm accumulation or a lasting change in demand.
The technical picture is similarly divided. Moving averages continue to favor sellers, while RSI, ADX, and MACD readings indicate that momentum is not particularly strong.
For now, the $1 area remains the central reference point for XRP today. Holding that level would keep the market in a consolidation phase, while a sustained break below it would weaken the near-term structure. Conversely, reclaiming $1.01-$1.02 and then pushing toward $1.04-$1.10 would provide clearer evidence that buyers are regaining control.
The immediate XRP story, therefore, is less about a long-term price forecast and more about whether the token can stabilize while underlying network activity remains elevated. That divergence between sentiment, technical structure, and blockchain participation is likely to remain central to XRP price news in the near term.

Jack Spencer is a financial journalist and crypto market analyst covering digital assets, blockchain innovation, and global market developments. His reporting focuses on cryptocurrency price trends, regulation, institutional adoption, and the evolving digital asset ecosystem.
View all stories by Jack Spancer →