 BTC
 ETH
 USDT
 BNB
 XRP
 USDC
 SOL
 TRX
 FIGR_HELOC
 ZEC
 HYPE
 DOGE
 XMR
 USDS

Sui Price Today: SUI Holds $1.15 Support as Bullish Momentum Builds Toward $1.34
SUI holds above the key $1.15 support as bullish signals sustain its recovery, with a break above $1.20 potentially opening the path toward $1.34.


The Sui price has gained considerably over the past month, although short-term indicators suggest that the rally may need a period of consolidation. Moving averages continue to support the broader recovery, but elevated momentum readings suggest temporary selling pressure.
SUI Price Holds Above $1.15 as Buyers Defend Support
SUI was trading around $1.171 against USDT on Binance in the supplied market snapshot, down approximately 2% over 24 hours. The session’s reported trading range was approximately $1.151 to $1.205, placing the token close to the $1.15 support area.
Despite the daily decline, SUI had advanced roughly 44% over the previous week and more than 52% over the month. The recovery has brought the token above several important moving averages, indicating improving momentum compared with its longer-term performance. However, SUI remained around 62% below its all-time high of approximately $5.37.
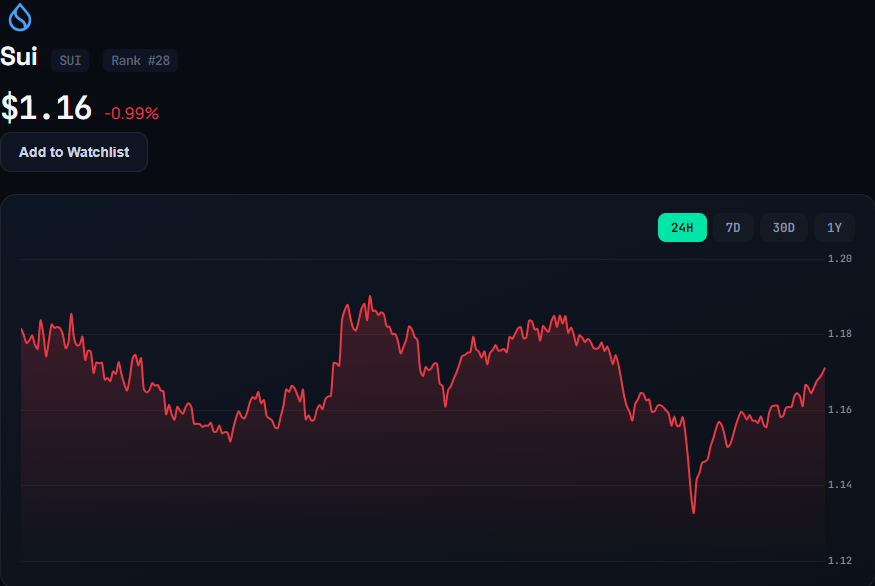
The 1.14–1.15 region is particularly relevant because it coincides with nearby technical support and the 50-period moving averages on the shorter-term indicator snapshot. Holding this area would preserve the current recovery structure. A sustained move below it, however, could expose the token to additional selling pressure.
Sui Crypto Price Prediction: Moving Averages Signal Continued Recovery
The moving-average readings in the supplied TradingView and Investing.com snapshots show a broadly positive technical structure. SUI was trading above its 5-, 10-, 20-, 50-, 100-, and 200-period moving averages, with the longer-term averages positioned below the shorter-term price action.
The 50-period simple moving average was around $1.146, while the 100-period average stood near $1.068. The 200-period simple moving average was approximately $0.998. These levels provide reference points for assessing whether the recovery is maintaining its upward structure.
The overall moving-average assessment was strongly bullish in the reported snapshot. However, moving averages are lagging indicators, meaning they reflect previous price movements rather than guaranteeing that the trend will continue.
The SUI Chart Shows 1.20–1.21 as Immediate Resistance
The immediate challenge for the Sui price is the resistance area between $1.19 and $1.21. Classic pivot calculations place the central pivot near $1.175, with resistance levels around $1.192, $1.201, and $1.218.
A sustained move above 1.20–1.21 would provide evidence that buyers are overcoming nearby selling pressure. The next technical reference points are around $1.24 and $1.26, followed by the $1.29 area.
The $1.34 level is a higher upside extension identified in the supplied hourly technical analysis. Reaching it would require SUI to move through several intermediate resistance zones. Consequently, it remains a conditional technical target rather than an established price direction.
RSI and MACD Highlight Strong but Uneven Momentum
Momentum indicators present a mixed picture of the current SUI rally. The supplied shorter-term technical readings show the 14-period Relative Strength Index (RSI) near 63, while the MACD remains positive at approximately 0.01.
These readings are consistent with improving buying momentum. However, other indicators suggest that the advance may be becoming stretched. The Commodity Channel Index (CCI) was near 199, while the Williams Percent Range was around -19, both indicating elevated momentum.
The daily RSI reading was higher, at approximately 73–74, placing it in traditionally overbought territory. Such readings do not necessarily signal an immediate reversal. They indicate that recent buying has been strong and that a pause or pullback is possible.
The daily Average Directional Index (ADX), reported above 35, also points to a relatively strong trend. However, ADX measures trend strength rather than direction, so it should be considered alongside price action and other indicators.
Elliott Wave Analysis Points to a Possible Pullback
One analyst’s Elliott Wave interpretation describes SUI as breaking out of a year-long bullish falling-wedge pattern, supported by increased trading volume. The analysis identifies the current advance as a smaller third wave within a larger upward sequence.
Under this interpretation, a fourth-wave pullback could precede another upward move. The analyst identifies the subsequent fifth wave as a potential extension while also anticipating a larger corrective second wave after the broader first wave is completed.
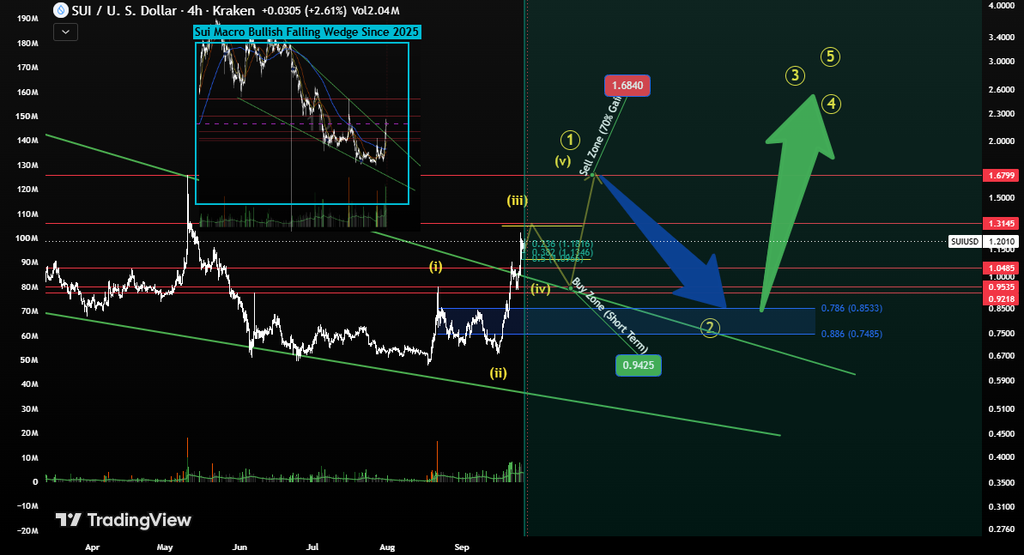
These projections depend on the validity of the proposed wave count and its underlying price structure. Elliott Wave interpretations can differ between analysts, particularly when identifying wave boundaries and alternative scenarios. The pattern therefore provides one possible framework for understanding the rally, not confirmation of future price movements.
SUI Price Prediction: $1.34 Target Depends on Key Levels
SUI’s path toward the $1.34 target will depend on how the price reacts around key resistance and support levels. A move above $1.21 with stronger volume could open the way toward 1.24–1.26 and $1.29 before $1.34 comes into focus.
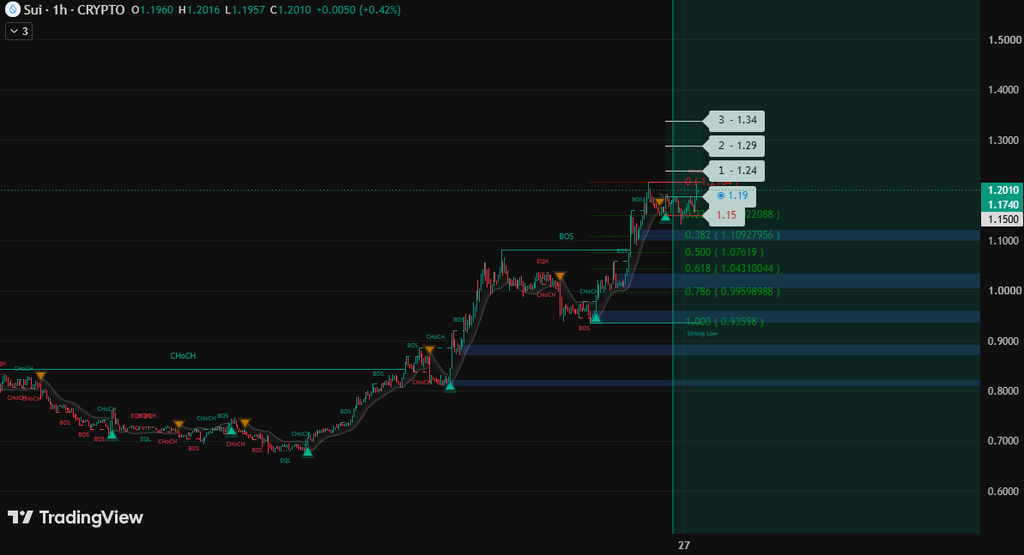
On the downside, 1.14–1.15 remains a key support zone. If SUI falls below this area, attention could shift to 1.06–1.02, while 0.92–0.94 represents a deeper support region.
Sui Ecosystem and Market Conditions Remain Relevant
Technical indicators provide only part of the picture. Broader cryptocurrency market conditions, trading activity, and developments across the Sui ecosystem can also influence demand for the SUI token.
The recent price recovery, as described in the supplied market data, demonstrates improving market momentum. However, the available articles do not establish whether the advance is being supported by sustained growth in network activity, changes in institutional participation, or other fundamental developments.
For a more complete Sui crypto price assessment, traders and researchers would need to examine on-chain activity, liquidity, token supply developments, and broader market conditions alongside the technical chart.
SUI Price Outlook
SUI’s immediate technical outlook remains constructive while the token holds above the 1.14–1.15 support area. The moving-average structure and positive MACD readings support the recovery narrative, while the elevated daily RSI and other momentum indicators suggest that volatility or consolidation remains possible.
The 1.19–1.21 resistance zone is the next important test. A sustained break above this area would bring 1.24–1.29 into focus, with $1.34 representing a further technical extension. Failure to maintain support, meanwhile, could shift attention toward the lower levels identified in the supplied analysis.
For now, the central question is whether buyers can maintain the recovery above $1.15 and establish a sustained move through 1.20–1.21. These levels provide a clearer framework for monitoring SUI’s price action than treating the higher target as a confirmed outcome.

Riva A. Nahar joins our team as a Crypto Journalist, covering cryptocurrency markets, blockchain developments, DeFi, and emerging trends across the digital-asset industry. With a focus on clear, accurate, and well-researched reporting, Riva brings a balanced perspective to fast-moving crypto news and market developments. Her work aims to make complex industry developments accessible while maintaining strong journalistic standards.
View all stories by Riva A. Nahar →