 BTC
 ETH
 USDT
 BNB
 XRP
 USDC
 SOL
 TRX
 FIGR_HELOC
 ZEC
 HYPE
 DOGE
 XMR
 USDS

Sui Price Today: SUI Holds $1.15 as Golden Cross and Strong Moving Averages Signal Bullish Momentum
SUI is trading near $1.15 as strengthening moving averages and an approaching golden cross point to an improving technical structure.


The latest indicator readings show a predominantly bullish bias, although neutral oscillators and recent selling pressure suggest that the Sui price recovery still faces important tests.
The Sui price prediction increasingly centers on whether the token can maintain its recent gains and build support above $1.15. While the moving-average alignment supports the prevailing uptrend, resistance around 1.20–1.29 and the more significant $1.42 swing high remain important levels to watch.
SUI Technical Indicators Signal Bullish Momentum
The SUI/USDT pair on Binance was recently quoted at approximately $1.1507, down around 0.16% in the referenced update. Despite the small decline, the aggregated technical summary indicates a buy signal, with 14 buy readings, 10 neutral readings, and two sell readings.
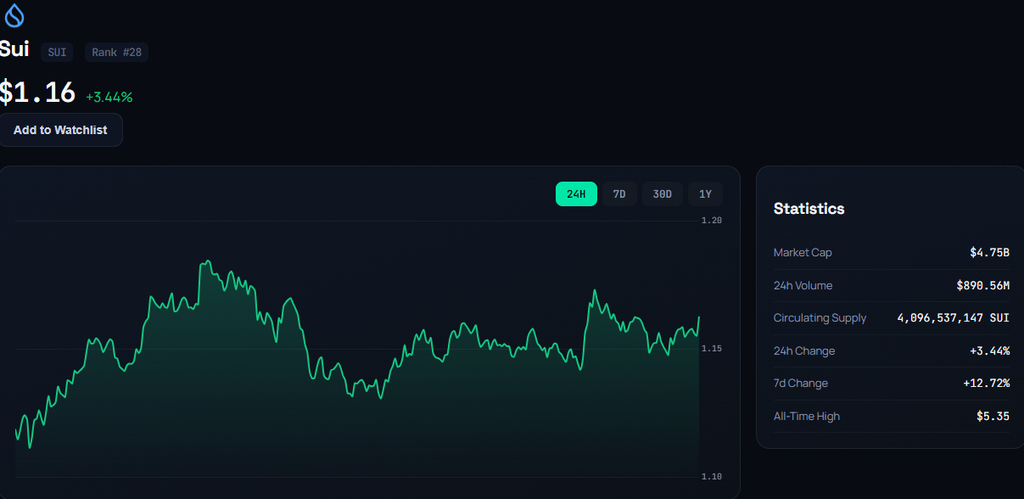
Moving averages account for much of this positive assessment. Their alignment suggests that SUI’s recent advance has improved the broader trend structure, with the token trading above most of its short-, medium-, and long-term averages.
However, oscillators present a more balanced picture. Their combined readings remain neutral, indicating that buying momentum has not translated into an equally strong consensus across every technical indicator.
Golden Cross Puts SUI’s Longer-Term Trend in Focus
SUI is approaching a potential golden cross on its daily chart, according to the analysis shared by market commentator AliCharts. This pattern occurs when the 50-day simple moving average crosses above the 200-day simple moving average. Traders commonly monitor it as a possible indication of improving longer-term momentum.
AliCharts points to previous golden crosses in December 2023 and October 2024, which were followed by substantial rallies. The commentator cites gains of approximately 240% and 222%, respectively, and projects a potential move toward $4 if a similar pattern develops.
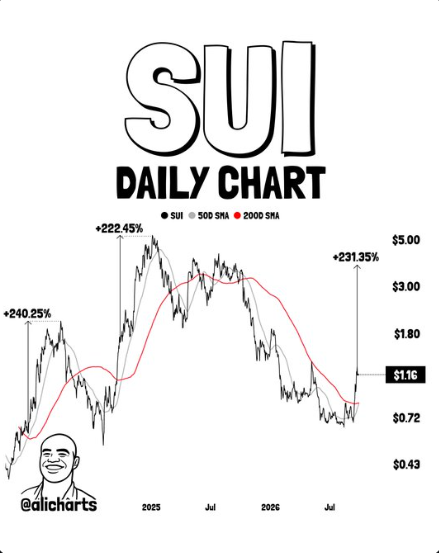
Those historical examples provide context, but they do not establish that another rally of comparable size will occur. A golden cross is a lagging indicator, meaning the underlying price advance may already be underway before the crossover becomes visible. Its significance also depends on broader market conditions and whether buyers sustain demand after the signal appears.
For the current Sui crypto price prediction, confirmation of the crossover and continued trading above key moving averages would offer more information than the pattern alone.
SUI Weekly Chart Shows Improving Market Structure
The weekly chart provides additional evidence of a developing recovery. The supplied analysis identifies a breakout above the $0.954 swing high, following a previous low near $0.635. This move represents an improvement in the token’s price structure, although it does not by itself confirm a sustained long-term reversal.
The 8-week and 21-week exponential moving averages have also crossed bullishly, with SUI trading above both. The accompanying increase in weekly buying volume suggests that participation strengthened during the advance.
Momentum indicators offer further context. The weekly Relative Strength Index has moved above 50 for the first time since September 2025, according to the supplied chart commentary. This shift indicates improving momentum, although the Stochastic RSI has entered overbought territory.
The token’s rejection near $1.29 is an important qualification. It shows that sellers remain active at higher prices and that the recovery has not yet cleared every significant resistance area.
RSI and Oscillators Show Mixed Momentum
The oscillator dashboard remains largely neutral, with nine neutral readings, one buy, and one sell. This distribution suggests a positive broader technical picture without unanimous confirmation from short-term momentum indicators.
The 14-period RSI stands at approximately 65.88. Although this is relatively elevated, it remains below the commonly used 70 overbought threshold. The reading is consistent with positive momentum but also warrants attention if the price continues rising rapidly.
The Stochastic %K is approximately 77.41, while the Commodity Channel Index is around 86.87. Both remain neutral in the supplied indicator summary. Meanwhile, the MACD reading of approximately 0.1138 signals Buy, contrasting with the Momentum (10) indicator, which issues a Sell signal.
Together, these figures suggest that upward momentum remains present, but its strength is not uniform across indicators. A cooling period would not necessarily invalidate the developing uptrend, particularly if SUI continues to hold its nearer support levels.
Key SUI Price Levels to Watch
The immediate technical outlook for SUI centers on the 1.09–1.11 support zone, which aligns with the short-term moving averages. Holding this area could keep the near-term structure constructive and allow buyers to retest higher resistance levels. The current price reference is around $1.15, while 1.20–1.21 represents the next resistance area to watch.
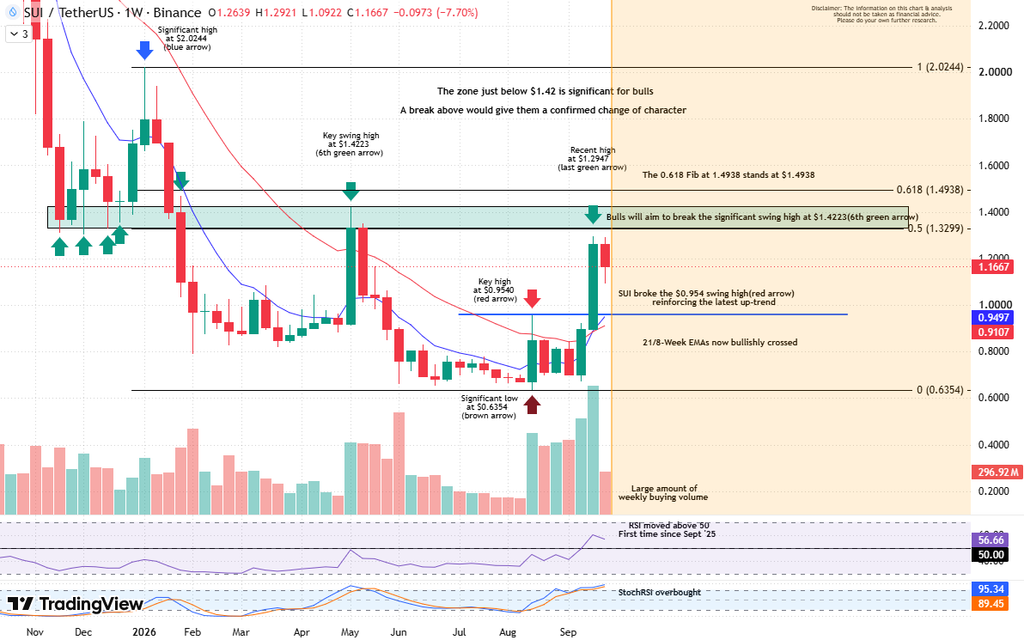
Above that level, the recent rejection near $1.29 remains an important hurdle. A sustained move above $1.29 would improve short-term price structure, while the $1.42 weekly swing high remains a more significant resistance level. The weekly analysis also identifies around $1.49 as the next reference, corresponding with the 0.618 Fibonacci level.
On the downside, a break below the 1.09–1.11 moving-average support could increase the risk of a deeper pullback toward the 0.98–1.00 region. If selling pressure continues, the 0.82–0.87 area could become relevant, as several longer-term moving averages are positioned there. These levels provide a framework for tracking whether SUI maintains its current recovery or enters a broader consolidation.
Sui Price Prediction: What Could Shape the Next Move?
The current Sui price prediction reflects a technically improving market rather than a confirmed, uninterrupted bullish trend. Strong moving-average readings, the weekly EMA crossover, and the potential daily golden cross all contribute to the positive outlook. Nevertheless, the rejection near $1.29 and mixed oscillator readings show why confirmation remains important.
A sustained hold above 1.09–1.11, followed by renewed buying pressure, would help preserve the short-term structure. A move through $1.29 could then put the $1.42 swing high into focus. Conversely, a loss of near-term support would raise the possibility of a deeper consolidation toward the next moving-average clusters.
The proposed $4 target from the golden-cross commentary is a separate, highly conditional scenario. It relies on historical comparisons rather than a confirmed price pattern or a guaranteed technical outcome. The available indicators do not establish a reliable timetable or probability for reaching that level.
For now, SUI’s price action around $1.15, the short-term moving-average cluster, and the $1.29 resistance area provide a more immediate framework for evaluating the recovery. These technical observations describe market conditions and should not be interpreted as a recommendation to buy or sell.

Riva A. Nahar joins our team as a Crypto Journalist, covering cryptocurrency markets, blockchain developments, DeFi, and emerging trends across the digital-asset industry. With a focus on clear, accurate, and well-researched reporting, Riva brings a balanced perspective to fast-moving crypto news and market developments. Her work aims to make complex industry developments accessible while maintaining strong journalistic standards.
View all stories by Riva A. Nahar →