 BTC
 ETH
 USDT
 BNB
 XRP
 USDC
 SOL
 TRX
 FIGR_HELOC
 ZEC
 HYPE
 DOGE
 XMR
 USDS

Sui Price Prediction: SUI Breaks Falling Wedge as $1.20 Resistance Puts $1.55 Target in Focus
SUI is testing a key resistance area near $1.20 after breaking above a multi-month falling-wedge pattern, putting the $1.55 region in focus if the breakout is confirmed.


The move comes as Sui’s broader market structure improves after recovering from its 2026 lows. However, the price remains below the $1.20–$1.205 resistance band, meaning the breakout has yet to develop into a confirmed trend reversal.
SUI breaks above the falling wedge
According to technical analysis shared by DoberInvest, SUI spent several months moving inside a falling-wedge formation before breaking above its upper boundary on the weekly chart.
The analyst highlighted a low near $0.7010 and pointed to the latest weekly candle as an important technical development because the breakout coincided with a noticeable increase in trading volume. The analysis also noted that the Relative Strength Index (RSI) had turned higher from depressed levels.
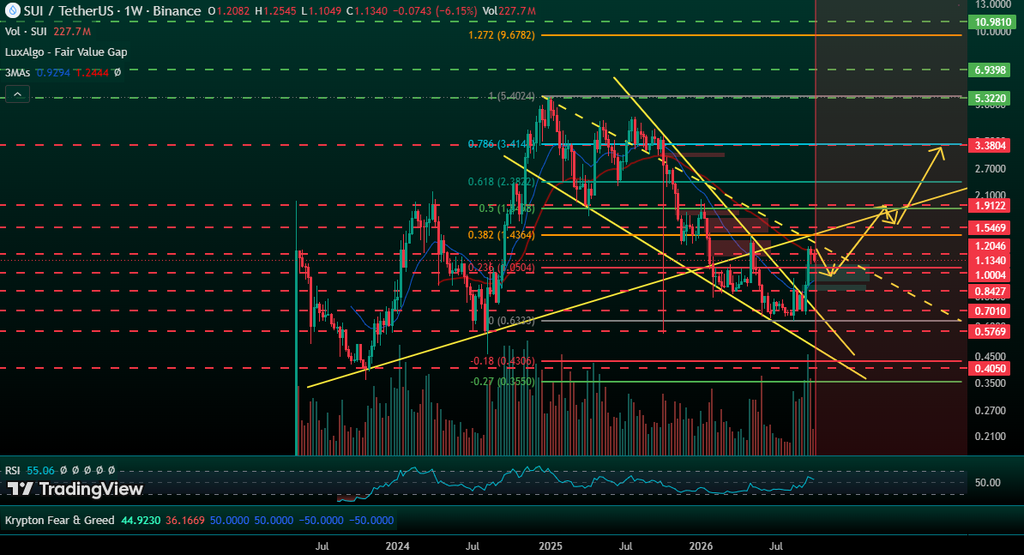
SUI was trading around $1.13 on October 8, according to recent market data. Daily pivot calculations place nearby support around $1.10, while resistance levels appear at approximately $1.17 and $1.21.
That leaves the $1.20 area as an important test for the current SUI price. A sustained move through that zone would provide stronger evidence that the falling-wedge breakout is holding rather than representing a temporary recovery.
1.20 resistance remains the key hurdle
The $1.20–$1.205 area has repeatedly acted as resistance during the recent recovery. Recent market analysis also identified resistance between roughly $1.192 and $1.205, reinforcing the importance of this region on the SUI chart.
Historical daily data shows that the price reached $1.27 on October 4 and $1.25 on October 5 before retreating toward the $1.18 area. The token subsequently moved lower, highlighting the selling pressure around the upper end of its recent range.
For the current SUI price prediction, the distinction between an intraday move above $1.20 and a sustained breakout is important. A daily or weekly close above the resistance band would carry more technical significance than a brief move through it.
1.55 target comes into focus
DoberInvest’s technical roadmap identifies $1.5469 as the first major upside objective following a confirmed breakout above $1.2046.
The level is close to the $1.55 target highlighted in this SUI coin price prediction. Beyond it, the analysis identifies $1.9122 as another potential resistance area, followed by $3.3804 in a more extended bullish scenario.
These levels should be viewed as technical projections rather than established future prices. The path toward $1.55 would require the price to first clear the $1.20–$1.205 region and maintain the breakout.
Other technical models also point to progressively higher resistance above the current market. DappRadar’s published levels place resistance around $1.26, $1.40, and $1.62 under its Fibonacci framework, although such models can differ substantially depending on the calculation period.
Support levels define the downside risk
While the breakout has improved the technical structure, SUI still has important support levels below the current market.
The first area to watch is around $1.10–$1.13. Recent price data shows several sessions where buyers emerged within or near this range, while current pivot calculations identify $1.10 as the nearest major weekly support.
DoberInvest’s chart analysis identifies $1.0004 as a deeper demand zone and links it to the 0.236 Fibonacci retracement area. The analyst’s broader bullish structure remains valid while the price holds $0.8427 on a weekly closing basis.
A weekly close below $0.8427 would therefore invalidate that particular bullish setup and increase the probability of a retest of lower support. The $0.7010 area represents the previous low highlighted in the analysis.
This creates a relatively clear technical framework: resistance around $1.20–$1.205, near-term support around $1.10–$1.13, and deeper structural support near $1.00 and $0.84.
Short-term indicators remain mixed
Recent market analysis has shown defensive readings on shorter timeframes, while daily indicators have been more constructive. That divergence suggests that the price is still consolidating after its strong recovery rather than moving through an established long-term uptrend.
CoinMarketCap’s October 7 analysis, for example, reported SUI near $1.12 after a rejection from the $1.20–$1.25 region and identified $1.11 as an important support level. It also noted that a failure below that area could expose the $1.02–$1.05 zone.
The conflicting signals explain why the current SUI crypto price remains sensitive to relatively small moves. A break above resistance could improve momentum, while renewed selling below $1.10 would weaken the near-term structure.
Elliott Wave viewpoints to another correction
A separate technical perspective from crypto analyst nology3000 interprets the current four-hour structure as a possible Wave 4 correction within an Elliott Wave sequence.
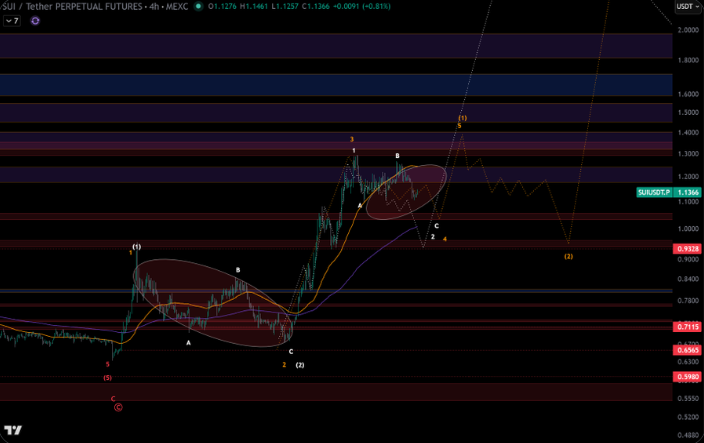
The analyst also identified October 11 as a potentially significant date based on time-based Fibonacci analysis. However, time-based projections do not guarantee a market reversal and should be treated as one technical scenario rather than a confirmed event.
The broader message is consistent with the price structure: SUI may be consolidating before its next major directional move, but confirmation still depends on how price behaves around the $1.20 resistance zone.
Sui ecosystem developments add fundamental context
Technical analysis is only one part of the SUI outlook. Developments across the Sui ecosystem provide additional context for the token’s longer-term valuation.
The token is a Layer-1 blockchain that uses delegated proof-of-stake and an object-based architecture. The SUI token is used for gas fees, staking, governance, and liquidity within the network.
The network has also reported major infrastructure developments this week. Sui said its Tunnels system processed more than 40.6 million transactions per second during a live stress test at Sui Basecamp, surpassing its previous reported 6-million-plus TPS record.
On October 8, the token also announced that Hashi mainnet is scheduled to begin a phased launch later this month, with more than $500 million in committed capital from its launch coalition. The initiative is designed to bring Bitcoin-backed financial activity onto Sui infrastructure.
Separately, the token announced work with the Linux Foundation Decentralized Trust and OpenAssets on standards for tokenized assets, a development aimed at improving interoperability for institutional applications involving securities, funds, and commodities.
These developments do not establish a specific future price for SUI, but they provide fundamental context for evaluating the growth of the Sui ecosystem.
SUI token supply remains a factor
Sui has a maximum supply of 10 billion tokens. Not all tokens entered circulation at the mainnet launch, and additional tokens are released according to a planned schedule. The Sui Foundation says the schedule can be adjusted to support the network’s long-term development and stability.
This means future token releases can affect the relationship between market demand and circulating supply. Investors and analysts therefore commonly monitor the SUI token unlock schedule alongside price and volume data.
At the same time, Sui’s network economics include a storage fund and mechanisms that remove some tokens from active circulation through storage-related fees. The foundation describes these mechanisms as part of the network’s broader token-economics design.
Sui price prediction: what comes next?
A sustained weekly move above that region would strengthen the case for a continuation toward the $1.55 area identified by the falling-wedge analysis. A move through $1.55 could then bring $1.91 into consideration, although each level would need to be established as support before a higher target becomes technically credible.
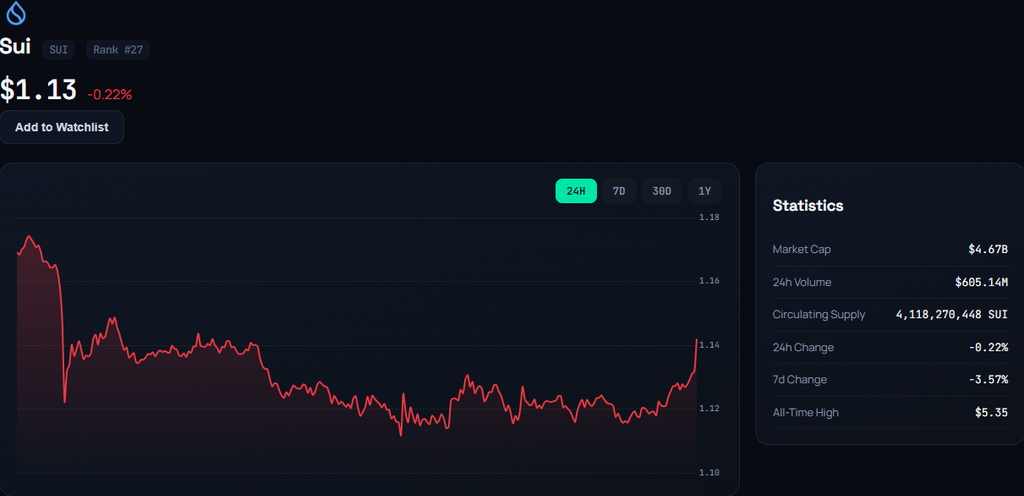
On the other hand, rejection near $1.20 followed by a loss of $1.10 would keep SUI trapped within its broader consolidation range. A deeper decline toward $1.00 would then become technically relevant, while a weekly close below $0.8427 would invalidate the specific bullish structure outlined by DoberInvest.
For now, the most important development is not the $1.55 target itself but whether the price can convert the falling-wedge breakout into a sustained move above $1.20. Until that happens, the current setup remains a technical possibility rather than a confirmed bullish trend.

Riva A. Nahar joins our team as a Crypto Journalist, covering cryptocurrency markets, blockchain developments, DeFi, and emerging trends across the digital-asset industry. With a focus on clear, accurate, and well-researched reporting, Riva brings a balanced perspective to fast-moving crypto news and market developments. Her work aims to make complex industry developments accessible while maintaining strong journalistic standards.
View all stories by Riva A. Nahar →