 BTC
BTC  ETH
ETH  USDT
USDT  BNB
BNB  XRP
XRP  USDC
USDC  SOL
SOL  TRX
TRX  ZEC
ZEC  FIGR_HELOC
  HYPE
HYPE  DOGE
DOGE  XMR
XMR  LINK
LINK 
Shiba Inu (SHIB) Price Prediction: Can a 405% Burn Surge Trigger a Breakout From the Current Downtrend?
Shiba Inu is showing mixed signals as a sharp increase in token burns coincides with a cautious technical setup.

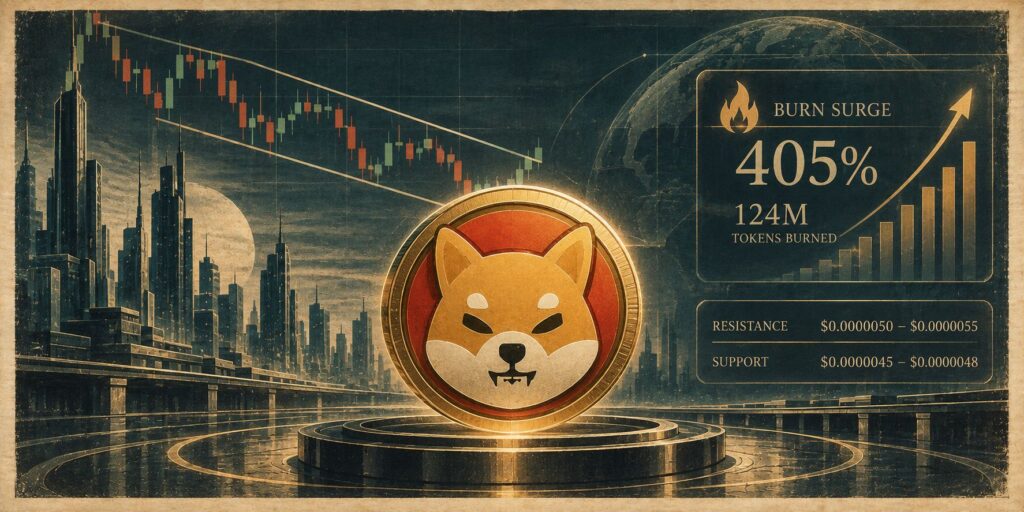
According to the latest data, Shiba Inu is trading near $0.00000497, while 24-hour burn activity jumped 405% to 124 million tokens, raising the question of whether the supply reduction can support a recovery.
The move comes as SHIB remains well below its previous cycle highs. Although short-term rebounds have emerged, the broader trend is still under pressure, with key resistance around $0.0000050-$0.0000055 and support near $0.0000045-$0.0000048.
SHIB Burn Rate Jumps 405%
According to an automated update from @shibburn, 124 million SHIB tokens were burned over the previous 24 hours, representing a 405% increase from the prior day’s figure.
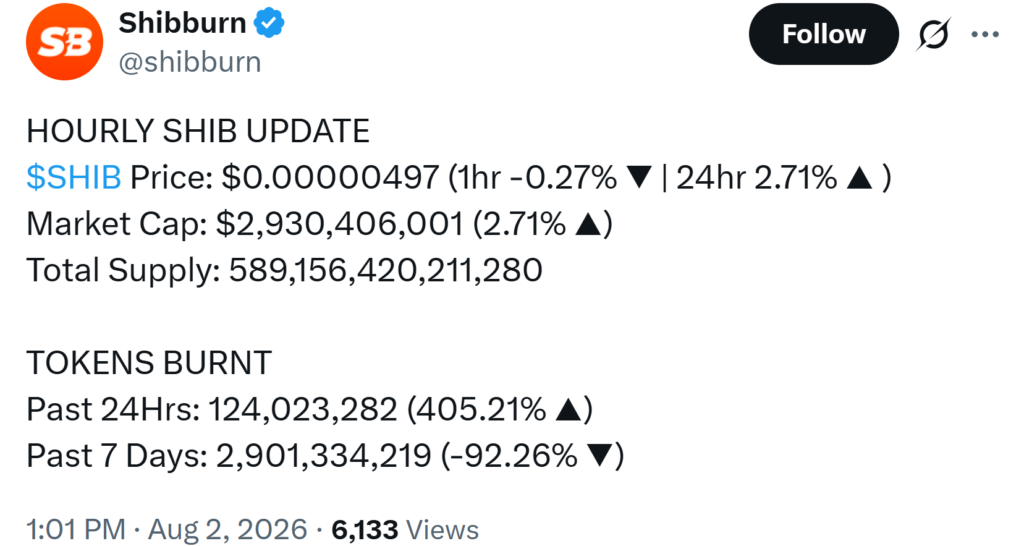
The increase is notable but needs to be placed in context. SHIB’s total supply remains around 589 trillion tokens, meaning the latest burn represents only a tiny fraction of the outstanding supply.
Seven-day burn activity also tells a different story. Weekly burns fell 92% to approximately 2.9 billion tokens, highlighting how quickly Shiba Inu’s burn activity can fluctuate.
The burn mechanism is designed to reduce the available supply over time. In theory, persistent supply reductions could support scarcity if demand remains stable or increases. However, the current burn volumes are not large enough to independently alter SHIB’s supply dynamics in the near term.
For the Shiba Inu price prediction, market demand and price structure are therefore more immediate factors to monitor.
Shiba Inu Price Faces a Critical Resistance Zone
SHIB is trading around $0.0000048-$0.0000049 in the latest technical snapshots, after experiencing considerable volatility in recent weeks.
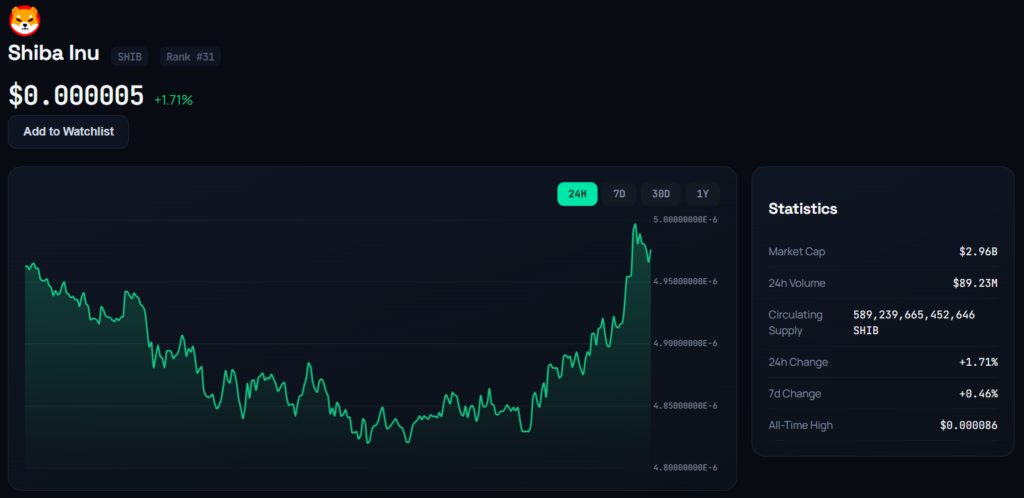
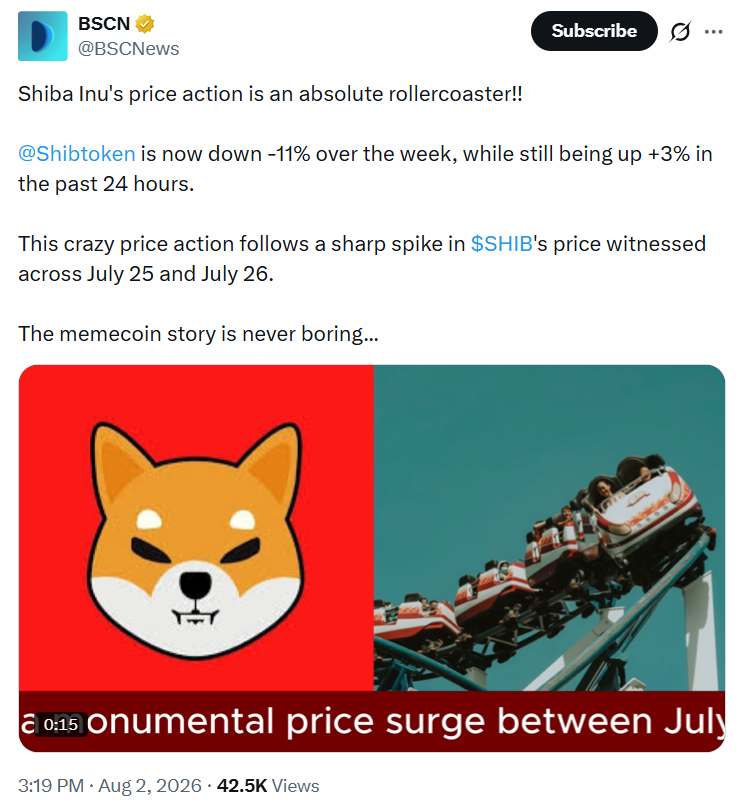
The token gained sharply between July 25 and July 26, climbing from roughly $0.0000042 to almost $0.0000058 alongside elevated volume. The rally was subsequently followed by a pullback, illustrating the rapid swings that have frequently characterized SHIB.
The latest data shows the token down roughly 8% over the week in some readings, despite monthly gains of approximately 9%-15%. Longer-term performance remains considerably weaker, with losses of around 28% over six months and year-to-date, while the one-year decline approaches 60%.
That divergence leaves Shiba Inu at an important technical juncture.
Immediate resistance is concentrated around $0.0000050-$0.0000055. A sustained move above this area would improve the short-term structure and could provide evidence that buyers are attempting to reverse the prevailing decline.
Two Valid Elliott Wave Scenarios
The daily Shiba Inu chart currently supports two possible Elliott Wave interpretations, according to analyst Mehdi_Abbasi_EWP.
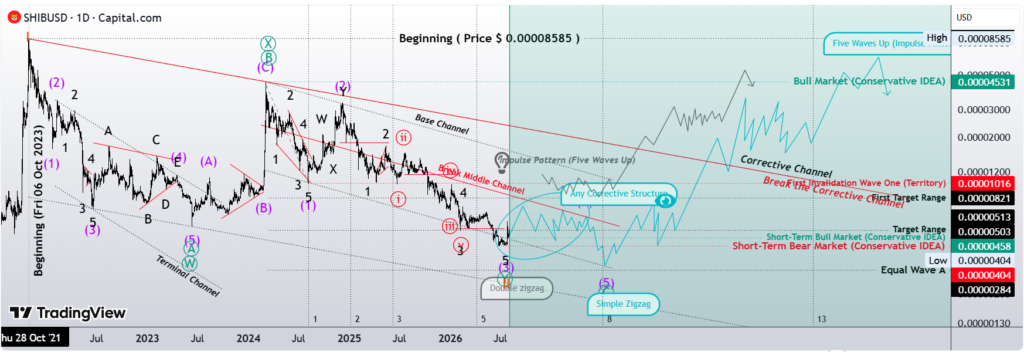
The first treats the ongoing correction as a completed or nearly completed Double Zigzag, or W-X-Y, structure. Under this interpretation, SHIB could be approaching the end of its corrective phase before beginning a larger bullish sequence.
The second scenario interprets the structure as a Simple Zigzag, or A-B-C. In this case, Wave C could still be developing, with Shiba Inu price potentially completing Wave (4) before another decline in Wave (5).
Neither scenario has been confirmed.
The analyst emphasized the importance of allowing price action to determine which structure remains valid rather than forcing a preferred outcome. That makes the current SHIB coin chart particularly important, as a break of key support or resistance could help invalidate one of the competing counts.
RSI Signals Caution
Momentum indicators remain mixed.
The Relative Strength Index (RSI 14) has appeared around 37-41 on some daily readings, placing Shiba Inu close to oversold territory but not necessarily confirming a reversal. Other timeframes have produced readings extending into the low 60s, highlighting the difference between short-term and broader momentum.
Stochastic %K has frequently remained in the teens to low 20s. Such readings can indicate weak momentum or oversold conditions, but they do not automatically establish a bullish signal.
The Commodity Channel Index (CCI 20) has also been deeply negative in some readings, around -141 and -119. These levels point to significant downside momentum and have generally produced neutral-to-sell interpretations.
The MACD (12,26) has similarly remained negative or close to zero in several observations, while Momentum (10) has been negative.
Together, these readings suggest that Shiba Inu has experienced sustained selling pressure despite occasional short-term rebounds.
ADX Shows a Developing Trend
The Average Directional Index (ADX 14) has ranged from approximately 24 to 44 across the referenced readings.
That range indicates moderate to strengthening trend intensity. In the current context, the signal does not establish whether the next major move will be bullish or bearish. Instead, it suggests that the prevailing price trend has enough strength to warrant attention.
Stochastic RSI, Williams %R and the Ultimate Oscillator have also generally leaned neutral to oversold or sell in the cited readings.
The combination leaves the broader technical picture tilted toward caution rather than a confirmed bullish reversal.
Moving Averages Keep the Trend Bearish
Moving averages provide another warning for the Shiba Inu price forecast.
The 10-, 20-, 30- and 50-period simple and exponential moving averages have frequently remained above SHIB’s current price, generating sell signals. This indicates that the token has not yet reclaimed several important short- and medium-term trend measures.
The Ichimoku Base Line, Volume-Weighted Moving Average (20), and Hull Moving Average (9) have also contributed to the sell bias in available readings.
Longer-term averages are more mixed, but the overall moving-average picture remains cautious. SHIB needs to reclaim multiple averages before a sustained recovery can be considered technically established.
Key Support Levels for Shiba Inu
The $0.0000045-$0.0000048 region is the immediate support zone to watch.
SHIB’s recent price action has repeatedly tested the lower end of its broader range, making this area important for determining whether buyers can continue defending the current levels.
A sustained break below $0.0000045 would weaken the short-term recovery case and could expose the token to lower support areas.
On the upside, $0.0000050-$0.0000055 represents the first meaningful resistance band. A break above it, particularly if accompanied by stronger volume, would provide a more convincing signal that buyers are regaining control.
Can Shiba Inu Price Break Out of the Downtrend?
The latest Shiba Inu price prediction remains conditional on how Shiba Inu behaves around these technical levels.
The 405% increase in daily burns provides a notable piece of Shiba Inu news, but the sharp decline in seven-day burn activity shows that the supply-reduction trend remains inconsistent. With roughly 589 trillion tokens still in supply, the latest burn alone is unlikely to materially change SHIB’s valuation.
Meanwhile, the Elliott Wave analysis leaves open both a potential corrective completion and the possibility of another bearish leg.
For Shiba Inu to establish a stronger bullish case, the token would need to hold above the $0.0000045-$0.0000048 support area and reclaim $0.0000050-$0.0000055 with convincing momentum. A sustained breakout could shift attention toward higher resistance levels.
Until then, the technical evidence remains mixed. SHIB has shown the capacity for sharp rebounds, but the longer-term trend, moving averages, and several momentum indicators continue to favor caution.
The burn surge is therefore an interesting development, but price action will ultimately determine whether Shiba Inu can turn its recent stabilization into a sustained recovery.

Jack Spencer is a financial journalist and crypto market analyst covering digital assets, blockchain innovation, and global market developments. His reporting focuses on cryptocurrency price trends, regulation, institutional adoption, and the evolving digital asset ecosystem.
View all stories by Jack Spancer →