 BTC
 ETH
 USDT
 BNB
 XRP
 USDC
 SOL
 TRX
 FIGR_HELOC
 ZEC
 HYPE
 DOGE
 XMR
 USDS

Bitcoin ETF Demand Holds Firm as Altcoin Trading Surges and BTC Tests $85K
Bitcoin is showing signs of renewed demand through U.S. spot ETFs even as its price remains trapped below recent highs.


At the same time, trading activity is shifting toward altcoins, with spot volumes outside Bitcoin expanding sharply as traders take on more risk.
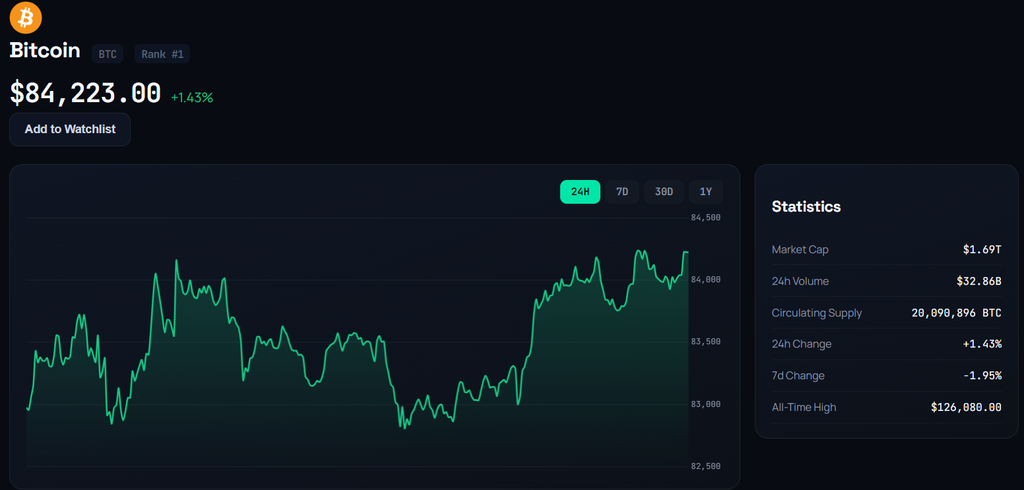
Santiment reported $2.77 billion in net Bitcoin ETF inflows between September 17 and September 27, marking seven consecutive positive U.S. trading sessions. BTC, meanwhile, has been moving between roughly $82,500 and $85,000 after retreating from weekly highs near $86,000-$87,000.
The combination of persistent ETF demand, reduced leverage, and rising altcoin participation is creating a market environment where Bitcoin and the broader crypto sector are moving through different phases of the same risk cycle.
Bitcoin ETF Flows Keep Institutional Demand in Focus
The latest Bitcoin ETF figures point to a renewed flow of capital into regulated investment products. According to Santiment, U.S. spot Bitcoin ETFs recorded $2.77 billion in net inflows over seven consecutive trading days through September 27.
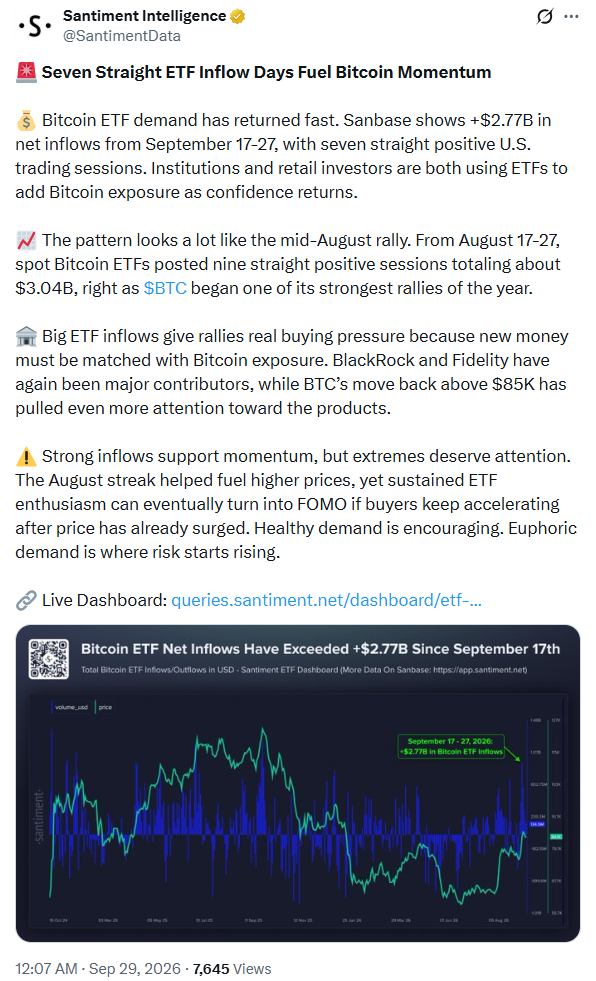
BlackRock’s IBIT and Fidelity’s FBTC were among the notable contributors to the recent inflows. The return of sustained ETF demand comes as BTC attempts to recover from its latest pullback.
Santiment also compared the current flow pattern with August. Between August 17 and August 27, spot Bitcoin ETFs recorded roughly $3.04 billion in inflows over nine consecutive positive sessions. That period coincided with a strong BTC advance.
The comparison provides historical context but does not establish a direct causal relationship between ETF flows and future bitcoin prices. ETF demand is one part of the broader market structure, alongside spot activity, derivatives positioning, and liquidity.
BTC Price Remains Inside a Narrow Range
Despite renewed ETF demand, Bitcoin has not yet reclaimed its recent weekly highs. BTC fell toward $82,500 after reaching approximately $86,000-$87,000, leaving traders focused on a narrower short-term range.
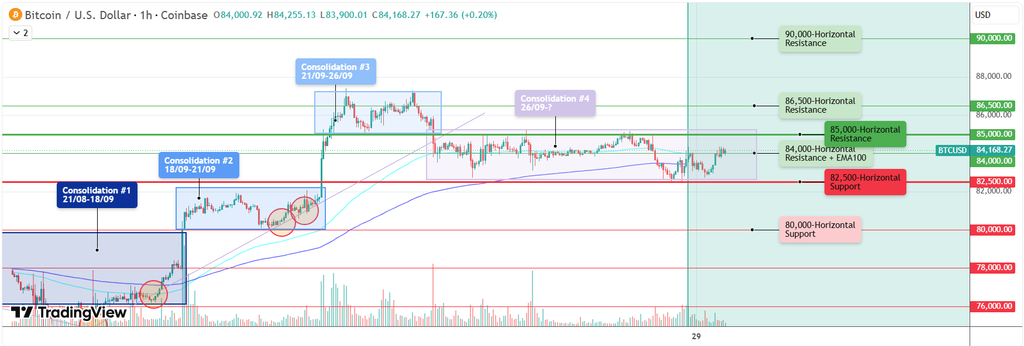
A TradingView analysis from contributor inchartswetrust identified $82.5K and $85K as the boundaries of the current range. The analysis also highlighted $84K as an important midpoint after BTC failed to maintain a move above that level.
The $84K region is further supported by the one-hour 100 EMA and 200 EMA, according to the analysis. These moving averages can provide reference points for short-term traders as BTC moves between support and resistance.
A sustained move above $85K would change the immediate range structure, while a loss of $82.5K would place greater attention on $80K. A deeper break below that level could bring the 76K-80K area back into focus.
These are technical levels identified in the cited analysis rather than confirmed future price targets.
Bitcoin Leverage Falls During the Pullback
Bitcoin’s derivatives market has also cooled as the price moved lower. CoinGlass data for Binance’s BTCUSDT one-hour market showed open interest declining during the recent pullback.
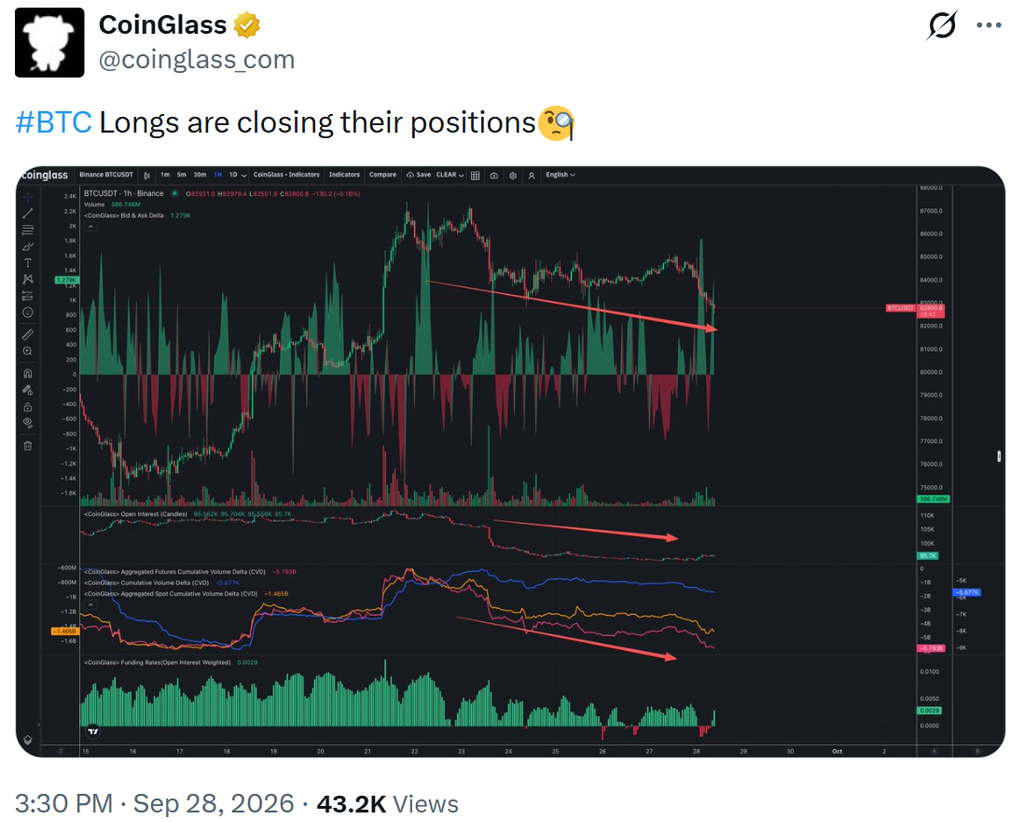
Falling open interest can indicate that leveraged positions are being closed. In this case, the move was accompanied by the unwinding of long positions as BTC declined from its weekly highs.
Reduced leverage can change the structure of the derivatives market by lowering the amount of outstanding exposure. However, it does not independently indicate whether the next major move in BTC will be higher or lower.
The distinction is important as Bitcoin approaches the monthly and quarterly close. Spot ETF inflows remain positive, while derivatives positioning has become less aggressive.
Altcoin Volume Expands Against Bitcoin
While Bitcoin’s derivatives leverage has declined, activity in the altcoin market has accelerated.
Glassnode data shows that seven-day spot trading volume in altcoins has risen to nearly four times Bitcoin’s volume. The ratio represents its highest level since September 2025 and highlights how much of the market’s trading activity has shifted beyond BTC.
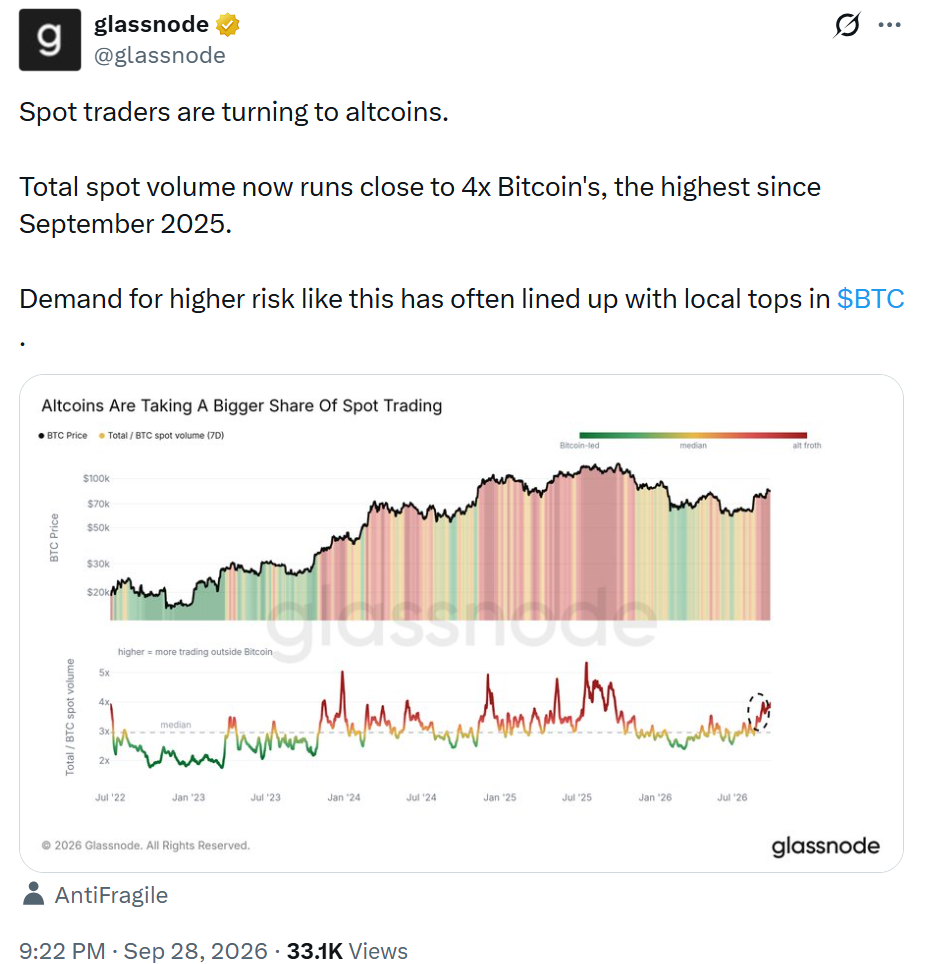
The data also identifies periods of elevated altcoin activity as “alt froth” zones. Similar increases in relative altcoin demand appeared around several local Bitcoin price peaks during 2024 and 2025.
That historical pattern is worth monitoring, but it should not be interpreted as a standalone Bitcoin price signal. Market conditions can differ considerably between cycles, and relative trading volume does not determine the timing of a market top.
Instead, the data shows that traders are currently allocating a larger portion of spot-market activity to higher-risk assets.
87% of Binance Altcoins Move Above 200-Day Average
The increase in altcoin activity is also visible in technical market breadth.
CryptoQuant contributor Darkfost reported that 87% of Binance-listed altcoins had moved above their 200-day moving averages. The figure represents a significant change from August, when most of the tracked tokens were trading below the long-term trend indicator.
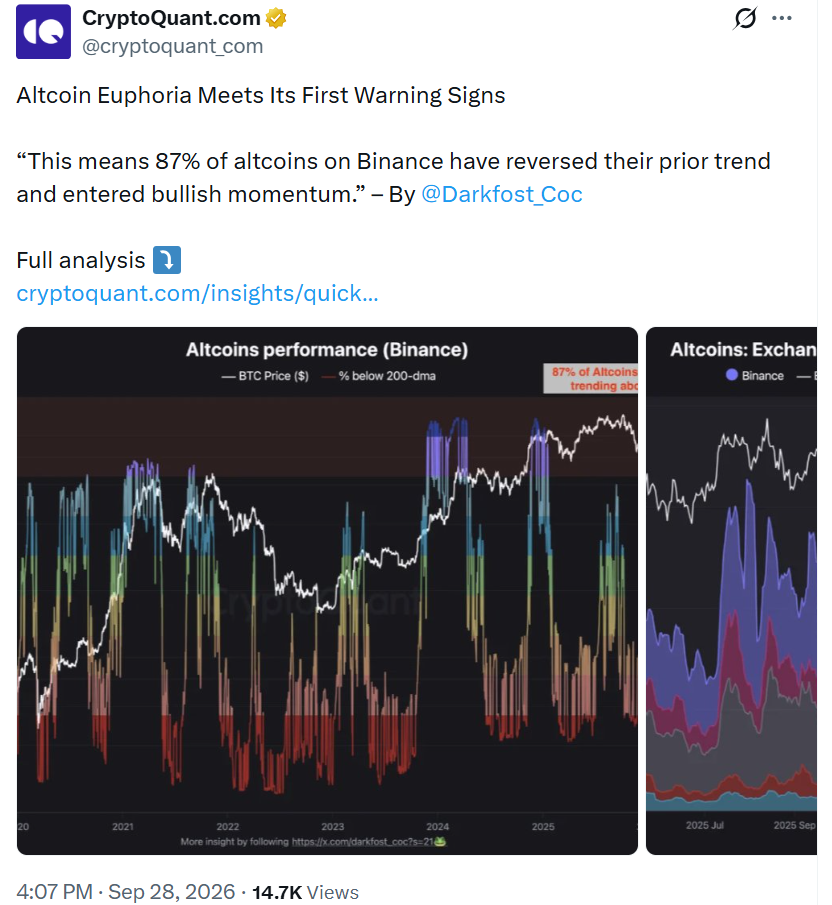
A rising percentage of assets above their 200-day averages generally indicates broader participation in an advance. In the current market, however, the improvement in breadth is accompanied by other signals that warrant attention.
CryptoQuant data showed altcoin exchange inflows reaching levels previously observed around earlier market tops. The data also showed that the Total2 market capitalization had increased by approximately $371 billion since June.
Darkfost highlighted a bearish RSI divergence alongside the broader gains, suggesting that momentum has not increased at the same pace as market capitalization.
Altcoin Gains Come With Higher Exchange Activity
Exchange flows provide another perspective on the recent altcoin expansion.
Higher deposits can accompany increased trading activity as investors move tokens onto exchanges to reposition portfolios. They can also increase the supply available for potential selling. As a result, exchange inflows need to be interpreted alongside price, volume, and investor behavior rather than treated as an automatic bearish signal.
The combination of strong altcoin performance and increased exchange activity has therefore become an important area for market observers.
The current environment differs from a market where only a small number of large-cap tokens are advancing. A substantial share of Binance-listed altcoins is now above its 200-day moving average, while altcoin spot volume has risen sharply relative to Bitcoin.
What the Market Data Shows
Several separate indicators are pointing to increased risk-taking across the cryptocurrency market.
Bitcoin continues to receive substantial capital through U.S. spot ETFs, with $2.77 billion in net inflows recorded during the latest seven-session streak. BTC, however, remains below its recent $86,000-$87,000 highs and is trading within a tighter range around $82.5K-$85K.
At the same time, altcoins account for an unusually large share of spot trading volume. Glassnode’s data places their seven-day volume at almost four times Bitcoin’s, while CryptoQuant’s figures show 87% of Binance-listed altcoins above their 200-day moving averages.
The data therefore describes a market with broader risk participation rather than a single-direction trend. ETF demand is providing continued support for Bitcoin exposure, while altcoin activity shows that traders are increasingly willing to move further out on the risk curve.
The key question for the market is whether this broader participation can continue alongside sustained spot demand. Bitcoin’s reaction around 82.5K-85K, future ETF flows, and the behavior of altcoin exchange deposits will remain important indicators as September draws to a close.

Julia Thornton is a cryptocurrency reporter covering blockchain, digital assets, and financial technology. She reports on market developments, regulation, exchange activity, and industry trends, delivering timely and accurate coverage of the global crypto ecosystem.
View all stories by Julia Thornton →